
Project Management
Module EftsureProjectManagement for eftsure inside Microsoft Dynamics 365 Finance & Operations
This is the handover document for the Eftsure Project Management module in Dynamics 365 Finance and Operations: what every tab does, how a deployment plan is built and kept current, and what to watch for. It is written for the partner or consultant running the implementation, and it assumes no prior knowledge of the module.
Introduction
Two minutes on what the module is and why it exists.
What this is
Eftsure Project Management is a project-planning workspace built into D365 F&O. It holds a tree of activities on a Gantt chart with dates, owners, budgets, dependencies and attachments, and it ships with the Eftsure deployment methodology — a complete, pre-written implementation plan that a new project is generated from in one dialog.
That second part is the point of the module. It is not a general-purpose project tool that happens to live in F&O; it is the Eftsure implementation methodology, made executable.
Who it is for
| Reader | What you get from it |
|---|---|
| Implementation partners and consultants | A plan you do not have to write. Every phase, task, owner role and piece of guidance is generated for you, sized to the customer's package and starting position. Projects Overview is your day-to-day reference; Setup is the work you do once. |
| Customer project managers and key users | A single place to see what is coming, who owns it, what is late and what the next two weeks look like — plus the written guidance attached to each task, so "configure the parameters" comes with the instructions. |
| Eftsure staff | A consistent view across every customer implementation, and status reports that assemble themselves. |
| Developers and integrators | Limits, gaps and cautions: how far the module has been tested, plus the rough edges in this build, what triggers them and what the remedy is. |
Why the methodology matters
The methodology is what a successful Eftsure deployment looks like, written down and made executable. Every phase, sequence, duration and owner role in it comes from implementations that have already gone live, so generating a project hands a first-time partner the same running order as a team on their fiftieth deployment. It is best practice you inherit rather than best practice you have to remember.
What you get
- A complete plan on day one. Every step for the chosen package is there, including the ones that only matter occasionally. Steps outside the package arrive marked Optional rather than missing, so a scope change later is a toggle, not a rebuild.
- A sequence that already works. Dependencies, durations and the gaps between phases are the ones that proved out on real deployments, so the plan paces itself correctly without anyone having to estimate it.
- Clear ownership from the start. Every task carries an Eftsure-side and a customer-side owner role, assigned once in the creation dialog and applied across the whole plan.
- Guidance attached to the work. Each activity carries its own written instructions — purpose, checklist, attendees, warnings — so whoever does the task has the manual in front of them.
- Reporting that writes itself. Because the plan is real data rather than a spreadsheet, the dashboard, the weekly status email and the exported deck are generated, not authored.
- A shared standard across customers. Two implementations generated from the same methodology version are directly comparable, and an improvement to the methodology reaches every project generated after it.
- A head start for support. The plan, the decisions and the Overview panels survive the implementation, so the team that inherits the customer inherits the reasoning too (Overview tab).
What it protects you from
Eftsure deployments rarely fail on anything hard. They fail on sequencing — a handful of steps done in the wrong order, each of which costs weeks to unwind. The generated plan puts those steps in the right place before anyone has to think about them.
| Without a plan | What the methodology does |
|---|---|
| The vendor master file is exported too late, so verification cannot start on time | Data extraction sits ahead of supplier verification, with the gap the analysis actually needs |
| Supplier outreach is due before the portal email account exists, so the first emails bounce or land from the wrong address | Portal and email configuration are early in the Eftsure Live Portal Setup phase, before any supplier is contacted |
| UAT starts before configuration is signed off, so testers raise defects against settings nobody has finished | Gap analysis and UAT configuration complete before the testing phase opens |
| Training lands weeks before go-live and is forgotten, or days after and is too late | Training is scheduled against the UAT and Live milestones rather than against whoever is free |
| Go-live is scheduled with no hypercare behind it, so the first problems land on an empty calendar | Hypercare is a phase of the plan, dated from go-live, not an afterthought |
| Optional work is deleted during scoping and then needed in week six | Out-of-package steps stay in the plan marked Optional, one toggle from being back in scope |
One dialog and three dates. The generator takes the implementation package, the project type and your kick-off, UAT and go-live dates, and builds the rest.
How to read this guide
| Section | Who it is for | What it covers |
|---|---|---|
| Projects Overview | Everyone | Every tab, every button, every field you will touch while running an implementation |
| Setup | Consultants and administrators | Deploying the module, templates, calendars, styles, security, import and export, upgrades |
| Limits, gaps and cautions | Everyone | How large and how deep a plan has been tested, and the rough edges in this build |
Bold is something you click or type; italic is the name of a record. All screenshots come from a demo project, Contoso Industries, generated from the deployment template and driven to about a quarter complete, so the charts and counters show real numbers.
Projects Overview
Finding the module
Open it from the Eftsure workspace: the rightmost icon in the workspace header, on the same row as New and the settings cog. Hovering it reads Projects — Project management for Eftsure projects.

The Projects icon at the right-hand end of the Eftsure workspace header
Searching the navigation for Projects gets you to the same place. The module is a single full-screen window with a strip of tabs across the top. With no project selected only the Projects tab is shown; the rest appear once a project exists.
Projects tab — your list of projects
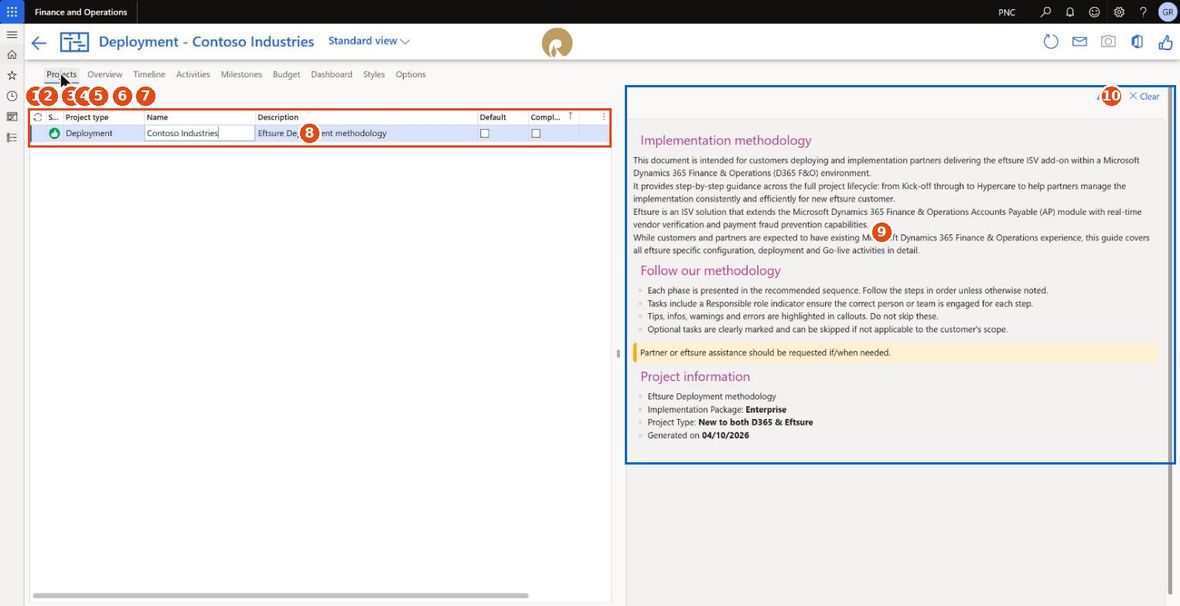
The Projects tab
The list of projects sits on the left, the selected project's notes on the right. The toolbar, left to right:
| Button | What it does | |
|---|---|---|
| 1 | New project | The menu described in Five kinds of project |
| 2 | Delete | Deletes the selected project and everything in it — activities, budgets, links, markers, styles, attachments. There is no undo |
| 3 | Import | Imports a DMF package (.zip) saved from this module (Data management — import and export) |
| 4 | Save | Exports the project — Exporting projects |
| 5 | Reset DMF | Clears the module's cached DMF entity definitions when a failed import has left them inconsistent. An administrator's tool |
| 6 | Logo | Upload a logo, or find one from the project name — Logo finder |
| 7 | Filter grid | Turns on the standard F&O column filter row |
| 8 | The list: status icon, project type, name, description, Default, Completed, and the methodology Version the project was generated from | |
| 9 | The notes pane — the methodology introduction on a generated project, yours to fill on a blank one | |
| 10 | Edit / Clear | Edit opens a rich-text editor over the notes; Clear empties it |
Delete removes the project and everything in it — activities, budgets, links, markers, styles and attachments — with no recycle bin and no undo. If there is any doubt, save a DMF package first (Exporting projects); that is the only format that restores a project completely.
Two columns change what you see elsewhere. Default marks the project the module opens on its own from other places in Eftsure. Completed archives a project: it hides the Dashboard, Milestones, Styles and Reports tabs and reveals Hypercare instead.
The row colour in this list comes from the project's own status — grey once Completed is ticked, red for a project in error, amber for one carrying a warning, and no colour for a healthy one.
Five kinds of project
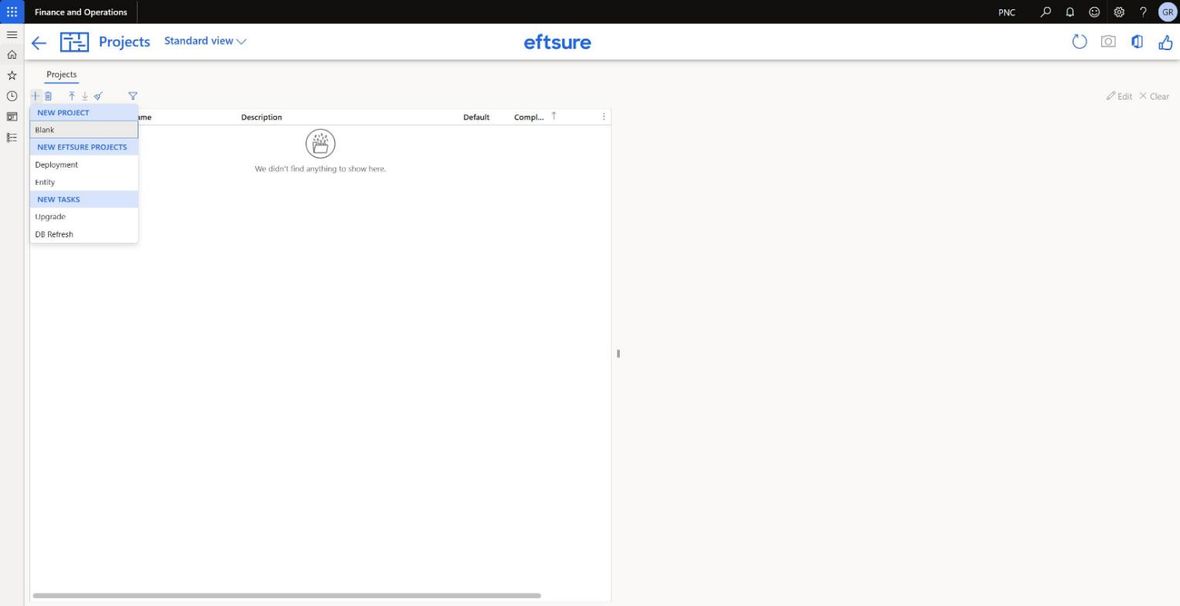
The New project menu
The New project menu is in three groups, and the difference between them matters.
New project
| What it creates | |
|---|---|
| Blank | An empty project — no activities, no styles, nothing. The project is created immediately with the name New project for you to rename in the grid. Use it when the methodology does not apply at all: an internal piece of work, a proof of concept, or a plan you want to build by hand. You get the Gantt chart, the budget, the dashboard and the exports; you supply the content. |
There is no default timeline to show for a blank project: until you create the first activity the Timeline tab draws nothing at all — no grid header, no time scale, just the toolbar.
New eftsure projects
These two generate a real implementation plan from the methodology template. Both open the dialog in Creating a new project.
| What it creates | When to use it | |
|---|---|---|
| Deployment | The full Eftsure implementation methodology — roughly 33 activities in eleven phases for the Enterprise package: Project Management, Project Kick-Off, Eftsure Live Portal Setup, Supplier Verification, Deployment, Gap & Data Analysis, UAT Configuration, Training, Testing, Go-Live and Hypercare. Four vertical markers (Kickoff, Training, UAT, Live), the dependencies between activities, and the standard style set come with it | A new customer going live on Eftsure. This is the one you will use most |
| Entity | A shorter plan — about nine phases — for rolling Eftsure out to an additional legal entity on a D365 instance where Eftsure is already live. It drops the first-time-only work (portal creation, core parameters, browser extension) and keeps what has to be repeated per entity: initial setup, supplier verification, configuration, training, testing, go-live | An existing customer adding a second company or country |
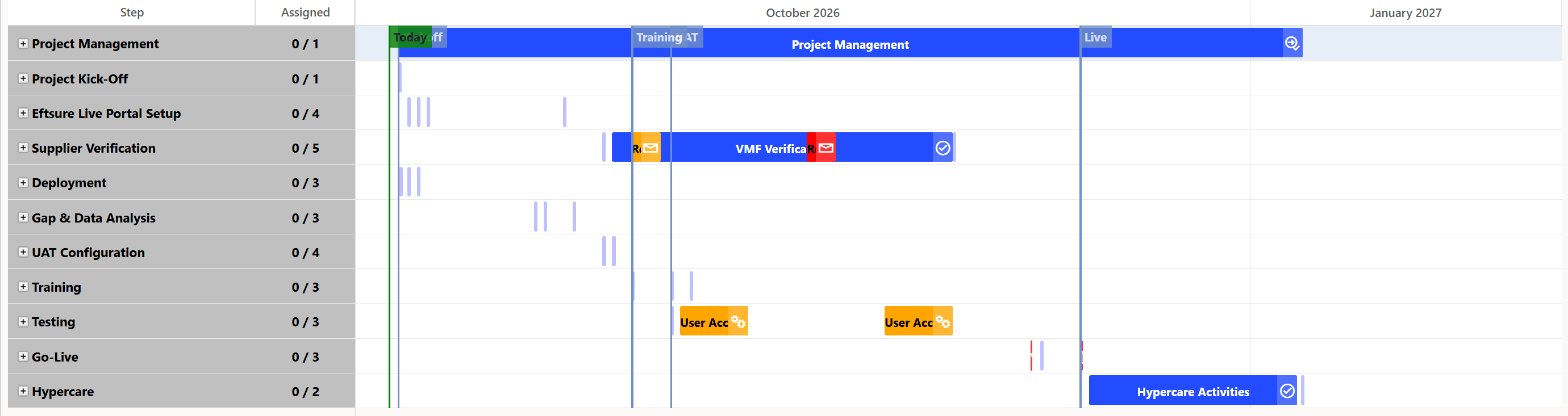
Deployment — the default timeline, eleven phases collapsed, with the Kickoff, Training, UAT and Live markers across the chart
The plan paces itself from the three dates you give it, so it is worth setting them to the window the project will really have.
- A customer already running both D365 and Eftsure takes about 8 weeks on average, and 6 weeks is the realistic minimum. Below that there is not enough calendar left for supplier verification to run its course.
- A customer new to D365 — a fresh D365 deployment, or an ERP change running alongside the Eftsure work — runs anywhere from 8 weeks to 18 months. The Eftsure activities are the same ones; what stretches is the D365 programme around them, so the Eftsure plan is paced to that rather than to its own content.
Anything between the two is a judgement call on how much of the customer's data and process work is already done.
A generated plan is a starting point for discussion, not a commitment. Send it to the customer to review and agree, and expect the dates to move once they have looked at it. Nothing downstream — the status email, the dashboard, the exports — is worth anything until the plan has been agreed by the people who have to do the work.
Be honest about what can and cannot be estimated:
- The elapsed time cannot be. It depends on how many people the customer puts on it in IT and in AP, how quickly they free them up, and how their own approvals run. None of that is knowable when the plan is generated, which is why the generated dates are a shape rather than a forecast.
- The integrator's effort can be. Installing a new release and promoting it through the environments — DEV to UAT to Live — is typically a 10 to 20 hour job. Where it lands in that range depends on your partner and on your own release process.
Quote the second number with confidence. Agree the first one with the customer rather than predicting it.
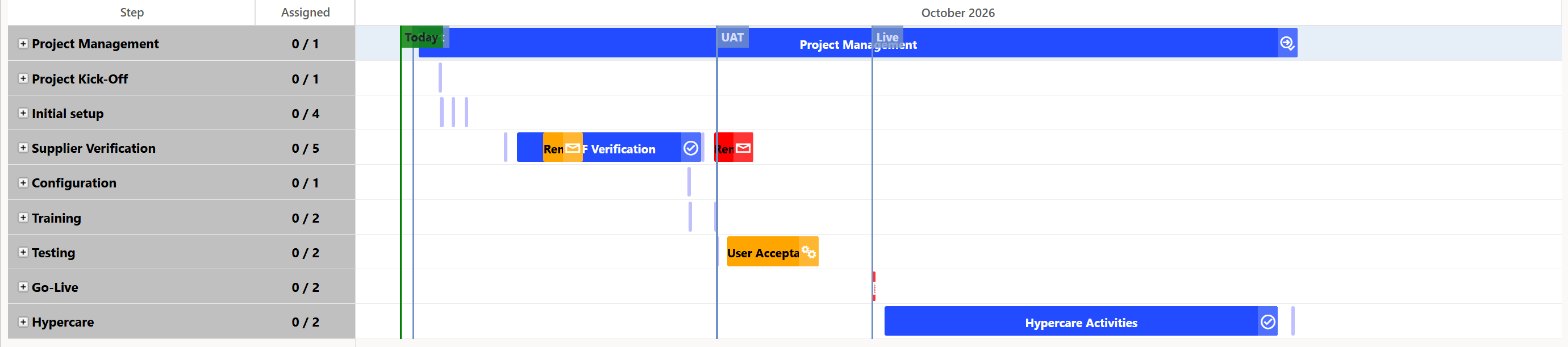
Entity — the default timeline, nine phases for a second legal entity
New tasks
These two generate short checklists rather than implementation projects. They still behave like projects — chart, grid, dashboard, exports — but they are measured in days rather than months.
| What it creates | When to use it | |
|---|---|---|
| Upgrade | Six phases — Introduction, Deployment, Configuration, Training, Testing, Live — covering an upgrade of the Eftsure model to a newer release: download the package, deploy to DEV and UAT, run the data upgrade, re-test, promote | Taking an existing customer from one Eftsure version to the next |
| DB Refresh | One phase with five steps — Prepare, Configuration (before go-live), Batches, Data Cleansing, Configuration (after go-live) — covering a production-to-sandbox database copy, where Eftsure configuration has to be re-pointed at the sandbox so it does not talk to the live portal | Every time IT refreshes a sandbox from production |

Upgrade — the default timeline, six phases over a fortnight

DB Refresh — the default timeline, one phase expanded to its five steps, with the optional Prepare step shown
The DB Refresh plan opens showing four steps and a counter of 0 / 4: Prepare arrives marked Optional and is hidden until you turn Show optional on, which is what the figure above does. Its creation dialog is the shortest of the five — one Start date, no package and no project type.
The project's type is stored and shown in the Project type column, and the window title reads Deployment — Contoso Industries, Upgrade — …, DB Refresh — … accordingly.
Creating a new project
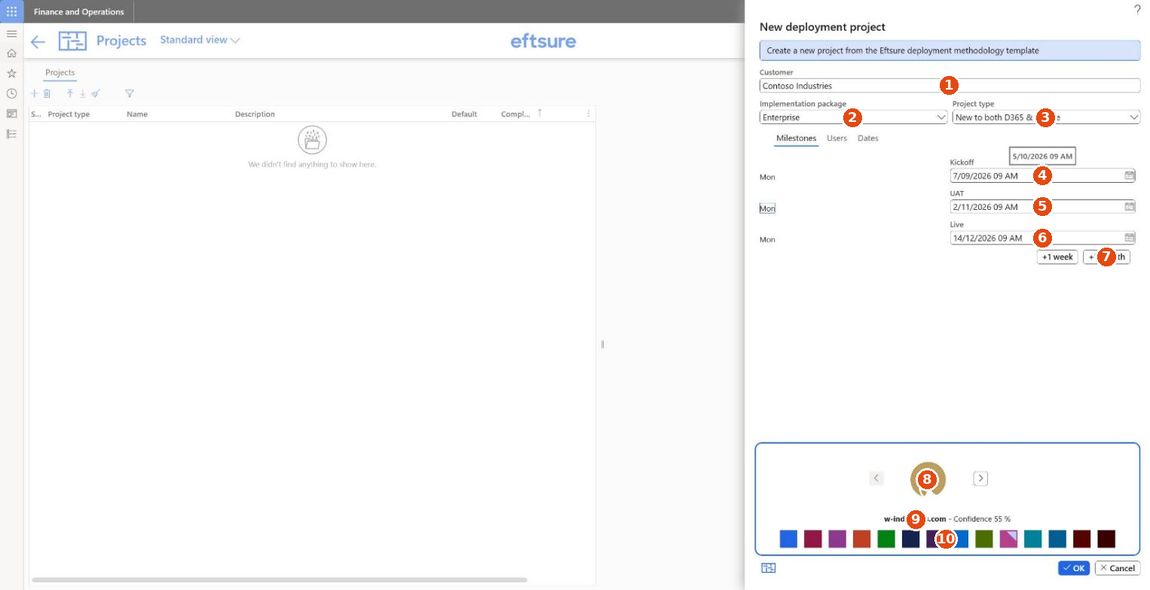
The new deployment project dialog
| Field | Notes | |
|---|---|---|
| 1 | Customer | Becomes the project name. Typing here also starts the logo search (Logo finder) |
| 2 | Implementation package | Essentials, Advanced or Enterprise. Controls how much of the methodology is generated and which activities arrive marked Optional |
| 3 | Project type | New to both D365 & Eftsure, Already deployed with D365, Already deployed with D365 & Eftsure, Eftsure already deployed, or Enterprise / International deployment(s). Drops the phases that do not apply to where the customer already is |
| 4 | Kickoff | The date the plan starts from. Everything else is scheduled relative to the three dates |
| 5 | UAT | The user-acceptance testing milestone |
| 6 | Live | The go-live milestone |
| 7 | +1 week / +1 month | Pushes all three dates out together, for when the start slips before you have even created the project |
| 8 | The logo the finder found — Logo finder | |
| 9 | The source and confidence of that logo | |
| 10 | The colour theme. Picking a swatch sets the project's accent colour, which the Overview banner, the dashboard, the exports and the status email all pick up |
The day of the week is shown beside each date, which is the quickest way to notice you have scheduled a kick-off on a Saturday.
Users pre-assigns the activities the template creates:
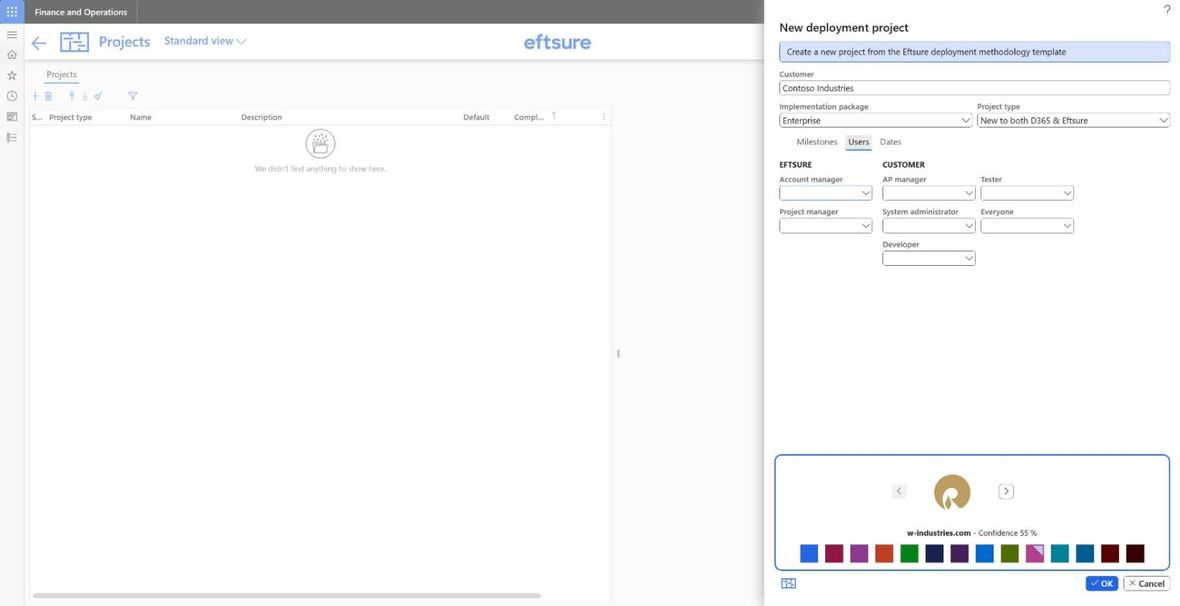
The Users tab
Eftsure side: Account manager, Project manager. Customer side: AP manager, System administrator, Developer, Tester, and Everyone — the fallback used by activities that are not role-specific. Anything left blank can be filled in later with the Assign button (Timeline tab → Reassigning, rescheduling and notifying).
Dates sets the two things that govern dates for the life of the project:
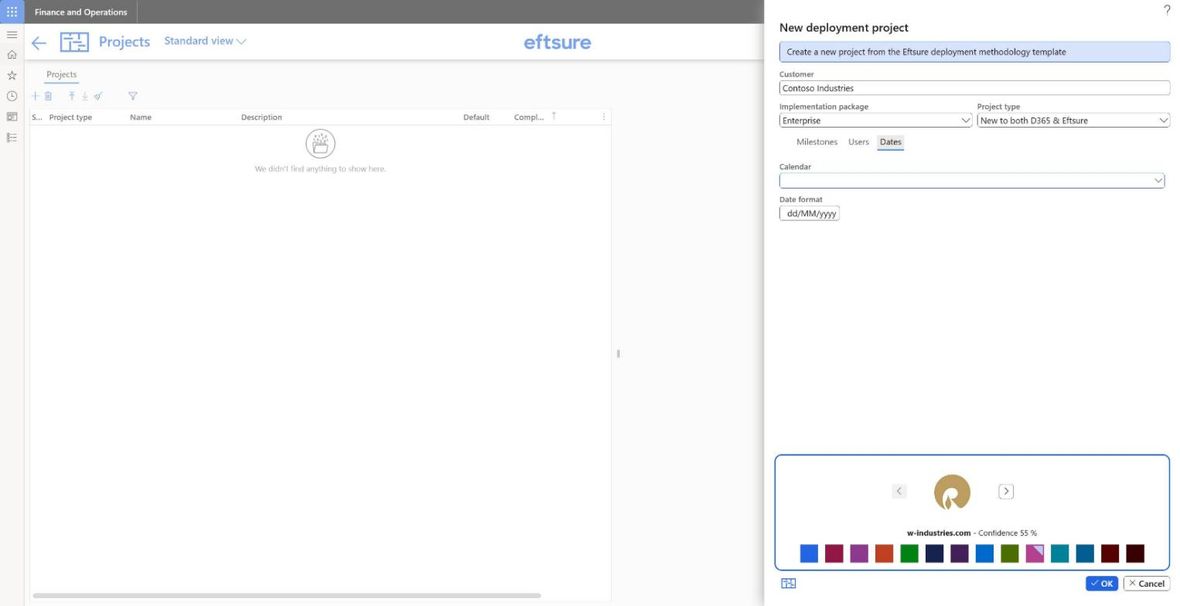
The Dates tab
- Calendar — the working calendar. Non-working time is shaded on the chart and a dragged activity will not start in it. Leave it blank and the project uses the shared default: Monday to Friday, 09:00 to 17:00.
- Date format — how dates are written in generated documents and emails (
dd/MM/yyyyby default). It does not change what you see on screen; that follows each user's own F&O settings.
Press OK and the plan is generated.
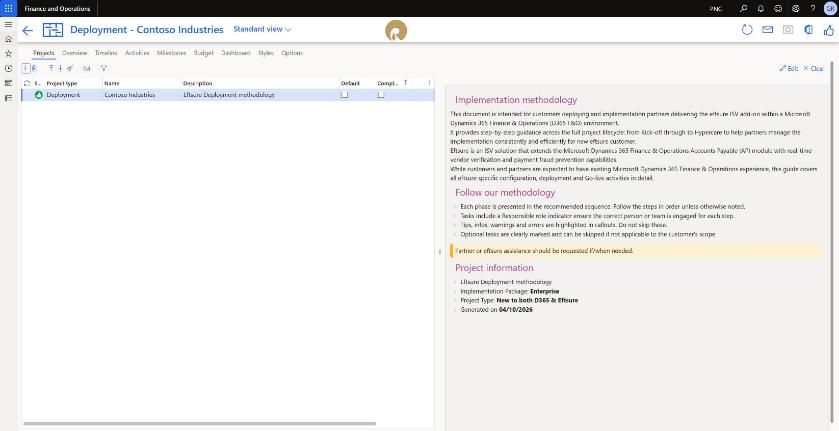
The project list after creating a project
What "package" and "project type" actually change
The two dropdowns are the only sizing decisions you make, and they are worth getting right because they decide how much plan you get.
- Implementation package is how much of Eftsure the customer has bought. Essentials generates the core path. Advanced adds the optional configuration steps. Enterprise generates the lot, including the international and multi-entity work. Steps outside the chosen package are still generated but arrive flagged Optional, so they are one toggle away if scope grows.
- Project type is where the customer is starting from. A customer already running D365 does not need the D365 deployment phases; one already running Eftsure elsewhere does not need the portal created from scratch. Choosing correctly here is what stops the plan containing a fortnight of work nobody will do.
Generate with the larger option and mark what you do not need as Optional. That is less work than discovering a missing phase in week six.
Logo finder
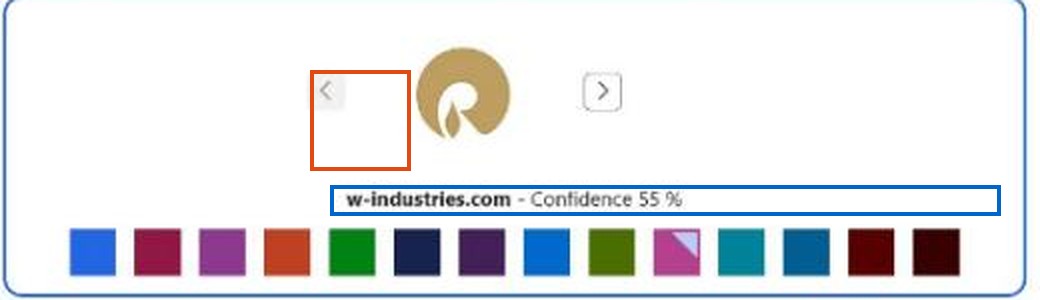
The logo finder
Type a customer name into Customer and the module goes looking for that company's logo on the web. A moment later the panel at the bottom of the dialog shows what it found, the source domain it came from, and a confidence percentage. The ‹ and › arrows step through the other candidates it found, so a wrong first guess is one click from the right one.
Two things happen when a logo is accepted:
- It becomes the project's logo — shown in the window header, on the Overview, on the dashboard, and in every generated document and status email.
- Its colours seed the colour theme swatches, which is why the demo project in this guide is plum rather than the default blue. The accent colour derived from the logo is what the Overview banner and the chart highlights use.
Why bother? Because the documents this module generates go to the customer. A status deck, a Word plan or a weekly email that carries the customer's own branding reads as their project rather than as a tool's output, and it costs one search to get there. The confidence figure is there so you can tell a solid match from a lucky one — on a distinctive name it will be high; on a generic one, check what it found before accepting.
The same two commands are on the Logo menu on the Projects tab afterwards, once for the customer logo and once for the partner logo:
- Upload — pick an image file yourself. Use this when the finder is wrong, when the customer has a specific brand asset, or when the logo is not public.
- Feeling Lucky! — re-run the search from the project name.
If the finder gets it wrong or finds nothing, nothing is lost: the project is created with no logo and the default theme, and you can upload one at any time.
Exporting projects
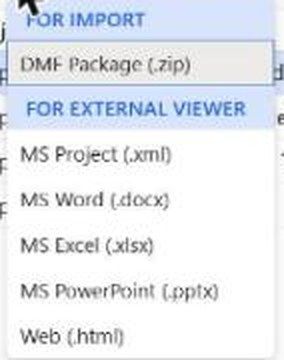
The Save menu
For import — DMF Package (.zip) writes a package containing every entity in the module: project, activities, links, milestones, vertical markers, styles, hypercare items and attachments. This is the only format Import can read back, and the only one that round-trips without loss.
For external viewer — five read-only formats for people who do not have D365:
| Format | What you get |
|---|---|
| MS Project (.xml) | A real MS Project file: tasks, hierarchy, dates, dependencies, assignments |
| MS Word (.docx) | The plan written out as a document, phase by phase, with each activity's guidance |
| MS Excel (.xlsx) | The activity list as a sheet |
| MS PowerPoint (.pptx) | A deck, for steering-committee packs |
| Web (.html) | A self-contained web page of the plan |
Those three collect the Overview, Timeline and Dashboard pictures before they generate anything, so each one starts with the browser's Choose what to share prompt (Screenshots). Answer it and the file arrives complete. Dismiss it and the file still arrives, without the pictures, and the window says the capture did not complete. MS Excel skips the capture altogether and never prompts.
Whether these are also filed against the project is controlled by Archive generated documents (Options → Documents). The Word, Excel and PowerPoint exports are produced from templates, so a partner can rebrand them without touching code. What the four attachments look like (later in this guide) shows each of them, page by page.
Project window
The Timeline tab, with the window header above it
Across the top of every tab: the back arrow, the project type and name, the F&O saved-view selector, the customer and partner logos, and — on the right — five buttons that are easy to miss and do a lot of the work.
Five buttons in the top right corner
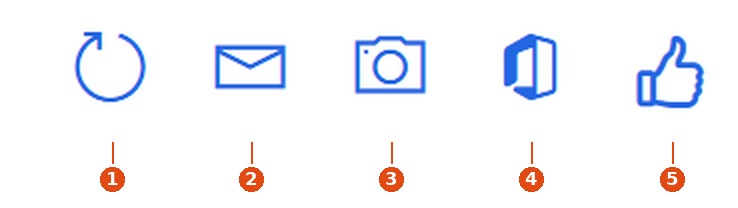
The header buttons
| Button | What it does | |
|---|---|---|
| 1 | Refresh | Re-reads the project from the database and redraws every tab. Use it when someone else has been editing the same project, or after a batch job has touched it. It does not discard anything you have typed — it commits first |
| 2 | Generate status update email | Builds the weekly status email: the Overview as a picture, the four export files attached, addressed to the lists on Options → Contacts. Covered in full in Status update email |
| 3 | Screenshot | Captures the tab you are looking at and files it on the Documents tab, where it can be annotated and downloaded. Covered in Screenshots |
| 4 | Open in Microsoft Office | Opens the module's data entities in Excel through the standard F&O Excel add-in, so you can edit activities in a sheet and publish them back. The menu offers All or one entity at a time: Project, Activities, Milestones, Links, Styles, Vertical Markers, Hypercare |
| 5 | Eftsure main menu | The Eftsure module's shared menu — onboarding, shortcuts, portals, support, help. Not specific to a project |
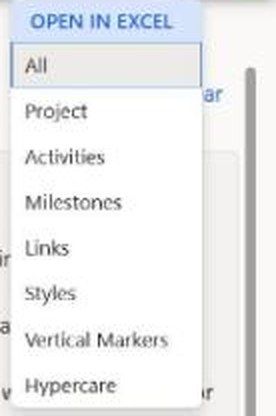
The Open in Excel menu
Buttons 2 and 3 are the most under-used features in the module. Between them they turn "write the weekly update" into two clicks.
Which tabs you see, and why
Not every tab is always present. A missing tab is almost always a setting rather than a fault:
| Tab | Shown when |
|---|---|
| Projects | Always, unless the form was opened filtered to a single activity |
| Timeline, Options | A project is selected, and the form is not filtered to a single activity |
| Overview, Activities, Milestones | …and the project is not marked Completed |
| Budget, Dashboard | A project is selected and it is not marked Completed |
| Styles | …and the Timeline is not in Use theme colours mode (Styles and theme colours) |
| Documents | Archive generated documents is on (Options → Documents) |
| Reports | …and the project is not marked Completed |
| Hypercare | The project is marked Completed |
Marking a project Completed is a bigger switch than it looks: it hides Overview, Activities, Milestones, Budget, Dashboard, Styles and Reports in one go and shows Hypercare instead. Timeline, Documents and Options stay, so the finished plan is still there to look at. Untick Completed and everything comes back — nothing is lost, only hidden.
The saved-view selector in the header is the standard F&O one — it saves filters and column layouts, not which tabs appear.
Overview tab
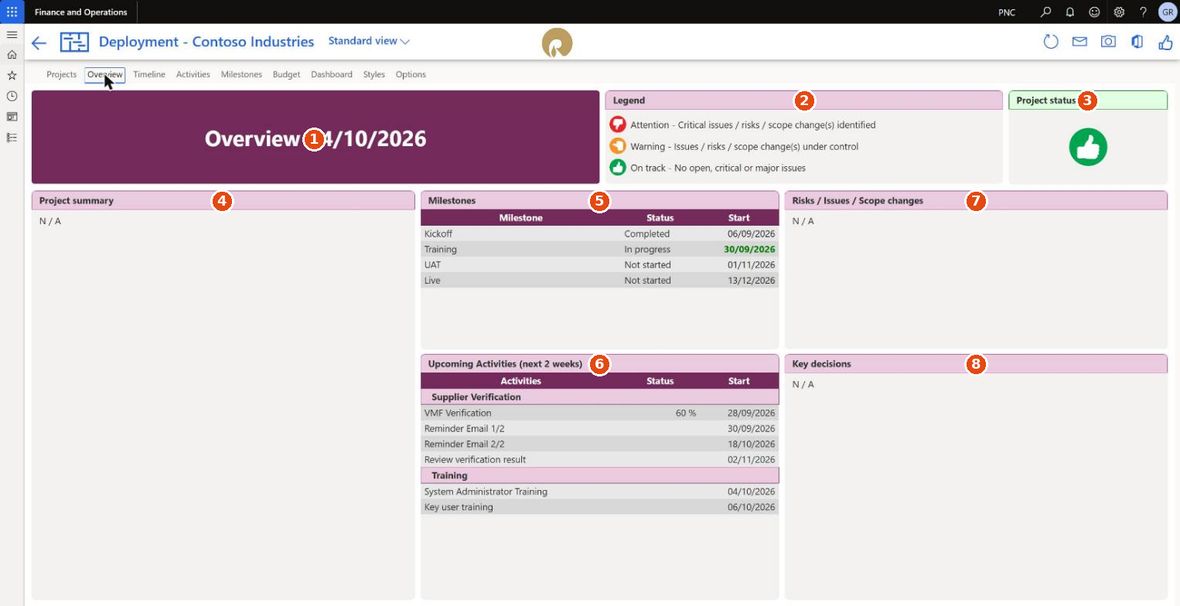
The Overview tab
A one-screen status summary, regenerated each time you open it. This is the picture that goes into the status email.
What this tab is for
The Overview is the project at a high level, and it is the only tab written for someone who was not in the room. Everything else in the module is detail — activities, dates, budgets, dependencies. The Overview is the half-page a reader needs to understand the customer, where the project got to and what was decided along the way.
That matters most after go-live. When the implementation closes, this tab is what is handed to the support team, so that whoever picks up the customer's first ticket already knows who they are, what was switched on for them and why. A support engineer reading a filled-in Overview should not need to ask the implementation manager anything.
It is kept current the same way each week:
- The Eftsure implementation manager owns the tab and fills it in during the weekly project status meeting, from the notes of everyone at the table — customer, partner and Eftsure.
- Once it has been updated, the status email goes out to every project member, carrying this tab as its picture (Status update email).
So the weekly rhythm is: meet, update the Overview, send. Five minutes of writing is what makes the rest of the reporting worth reading — and what the support team inherits at the end.
Panels
| Panel | Contents | |
|---|---|---|
| 1 | Title band | Project name and today's date, in the project's accent colour |
| 2 | Legend | What the three project-status symbols mean |
| 3 | Project status | The symbol you set by hand for this project. Click it to change it |
| 4 | Project summary | Who the customer is and where the project stands, with the key dates |
| 5 | Milestones | Every vertical marker with its status and date. The next one due is picked out in green |
| 6 | Upcoming activities (next 2 weeks) | Activities starting in the next fortnight, grouped under their phase, with completion percentages |
| 7 | Risks / Issues / Scope changes | Anything that could change the plan, the date or the price |
| 8 | Key decisions | What was decided and why — above all, configuration decisions |
Project status and the legend

The legend and the project status panel
Three statuses, each a coloured hand. The Legend panel spells them out; the Project status panel shows the one in force, and tints its own header to match.
| Symbol | Status | What it means |
|---|---|---|
| Red thumbs-down | Attention | Critical issues / risks / scope change(s) identified. Something needs a decision or an escalation now |
| Amber thumbs-sideways | Warning | Issues / risks / scope change(s) under control. Known problems, owned and being worked, with no help needed yet |
| Green thumbs-up | On track | No open, critical or major issues |
Set it by clicking the symbol. There is no dropdown and no Save — each click advances to the next status and writes it immediately. From green, the clicks go:
- On track (green) — the starting point on a new project.
- Warning (amber).
- Attention (red).
- Back to On track, and round again.
Three clicks return you to where you started, so a mis-click is undone by carrying on round rather than by cancelling. The value is written the moment you click and survives a reload.
Set it to match what the Risks / Issues / Scope changes panel actually says. The symbol is the first thing a reader looks at and the only part of the Overview that is a judgement rather than a fact, so an amber project with an empty risks panel — or a green one with three open risks — is worse than no status at all.
Three free-text panels
Project summary, Risks / Issues / Scope changes and Key decisions are rich-text fields on the project, and they are the part of the Overview that only a person can write. Click a panel to edit it — the HTML editor described in Writing in the HTML fields opens. Each shows N / A until you fill it.
| Panel | What belongs in it |
|---|---|
| Project summary | The project's standing facts: who the customer is, what is being implemented and for which entities, which Eftsure package, who the key people are on both sides, and the key dates — kick-off, UAT, go-live, the end of hypercare. A reader who knows nothing about this customer should be able to start here |
| Risks / Issues / Scope changes | The project's critical information: open risks and who owns them, issues currently blocking or slowing the work, and any change to the agreed scope — what changed, who asked for it and what it costs in time or money. This is the panel the project status symbol is a summary of |
| Key decisions | The decisions taken and the reasoning behind them, above all the configuration ones: which features and options were switched on or left off, which parameters were set and why, which integrations and file formats were chosen, which exceptions were agreed. This is the panel the support team will reread most often, because it answers “why is their system set up like this?” |
Write them for the reader who comes after you. These three panels, plus the status symbol, are what the status email carries and what the generated Word, PowerPoint and Excel documents draw on, so an Overview left on N / A goes out to the whole project team saying N / A.
At the end of hypercare, this tab is what is handed to the support team. It is the only record they receive of who the customer is, what was configured for them and why those choices were made. Whatever is not written here is lost when the implementation team moves on — the knowledge does not exist anywhere else in a form support can read.
So these panels are not weekly-status housekeeping. Every week you fill them in properly, you are writing the handover a little at a time instead of trying to reconstruct it from memory on the last day. An Overview left on N / A hands the support team a customer they know nothing about.
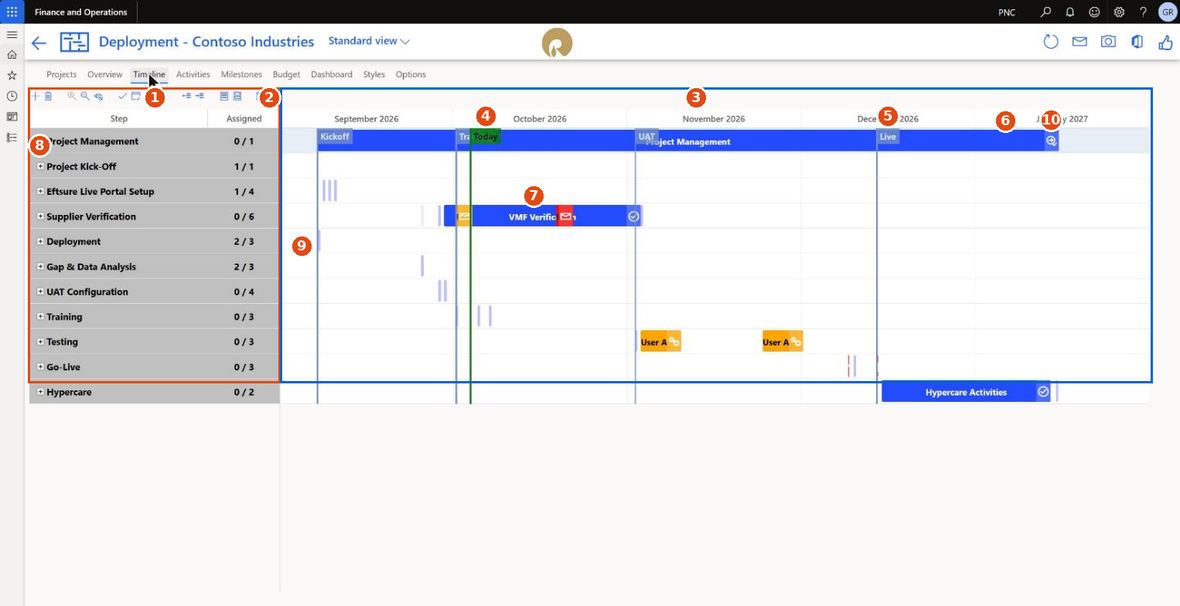
Timeline tab — the Gantt chart
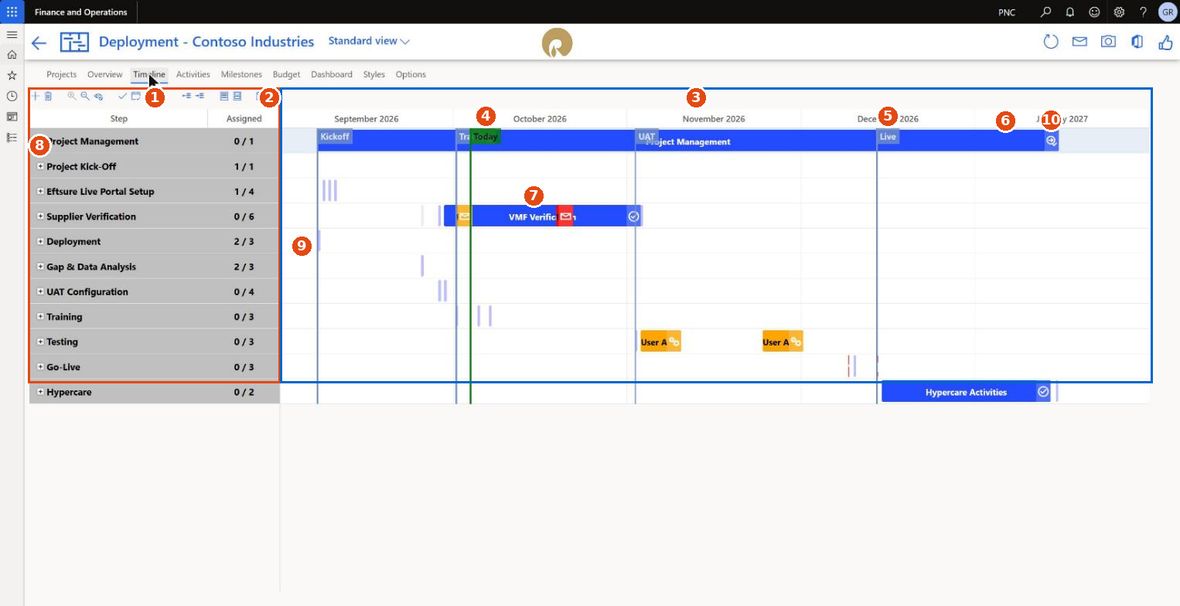
The Timeline tab
| What it is | |
|---|---|
| 1 | Step — the activity tree. Summaries in bold, children indented beneath |
| 2 | Assigned — completed / total for a summary. 2 / 3 means two of its three activities are done |
| 3 | The time scale |
| 4 | The Today line, in green |
| 5 | A vertical marker — a dated line across the whole chart |
| 6 | A summary bar, spanning its children |
| 7 | An activity bar; the icons on it come from the activity's symbol and its links |
| 8 | The expand / collapse chevron |
| 9 | The selected row, highlighted across both panes |
| 10 | The chart's own zoom-to-fit control |
Toolbar

The Timeline toolbar
| Button | What it does | |
|---|---|---|
| 1 | New activity | Menu: Summary, Activity, Milestone. Asks for the name first, then creates it under the selected row |
| 2 | Delete | Deletes the selected rows and everything beneath them (Timeline tab → Deleting) |
| 3 | Zoom in | Finer time scale |
| 4 | Zoom out | Coarser time scale |
| 5 | Show / Hide optional | Toggles activities marked Optional in and out |
| 6 | Mark completed | Sets the selected activity to 100 % |
| 7 | Schedule | Shifts the selection by days and hours |
| 8 | Assign | Reassigns the selection |
| 9 | Notify | Emails the assignee |
| 10 | Decrease indent | Promotes the selection a level — it becomes a sibling of its old parent |
| 11 | Increase indent | Demotes it a level — it becomes a child of the row above |
| 12 | Expand all | Opens every summary |
| 13 | Collapse all | Closes every summary |
| 14 | Time scale | Sets the minor unit and increment by hand |
| 15 | Use theme colours | Swaps the per-activity styles for the project's theme colours |
Selecting
Click a row in the grid or a bar in the chart. Ctrl+click adds to the selection; the buttons that accept several rows — Delete, Mark completed, Schedule, Assign — act on all of them.
Creating activities
The + button opens a short menu first — Summary, Activity, Milestone — so you choose what you are making before anything is created. Picking Activity or Milestone then asks for the name, so the new bar arrives already named; cancel that prompt and nothing is created. The new row is created under the row you had selected, last among its children.
A new row is given a one-hour slot starting at the current date and time rather than snapped to the next open working moment, so expect to set its dates straight afterwards.
Reassigning, rescheduling and notifying
Three drop-down dialogs act on whatever is selected.
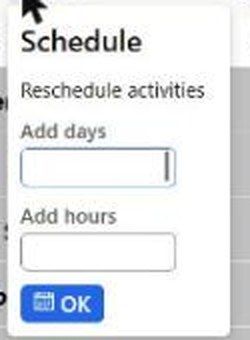
The Schedule dialog
Schedule adds a number of days and hours. Negative numbers pull the selection earlier. The working calendar still applies, so nothing lands in closed time.
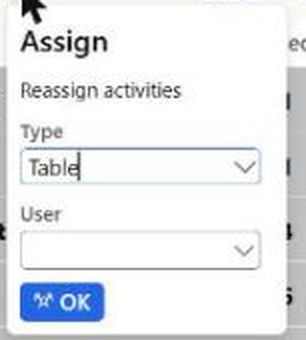
The Assign dialog
Assign sets the owner. Type picks whether you are assigning to a user, a user group or a table group; User picks the value. Changing the type clears the value underneath, so a name chosen under the old type cannot be left behind.
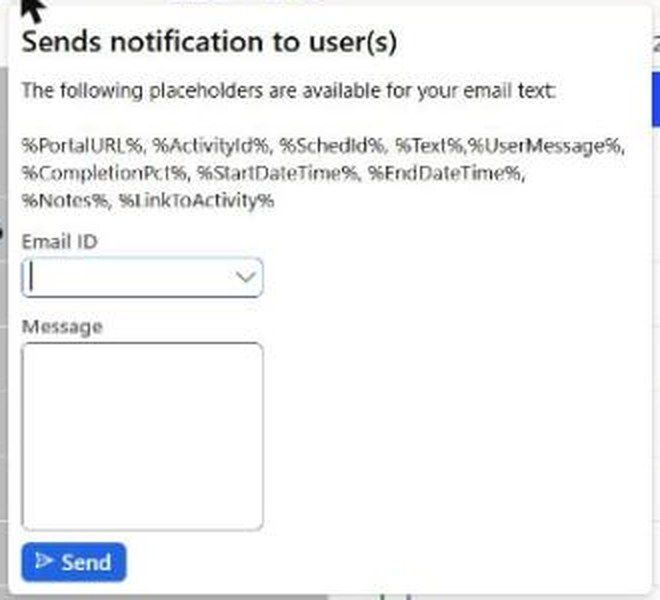
The Notify dialog
Notify emails the people responsible for the selected activities. Pick an Email ID (a mail template) and add a Message. These placeholders are substituted into the template:
%PortalURL% · %ActivityId% · %SchedId% · %Text% · %UserMessage% · %CompletionPct% · %StartDateTime% · %EndDateTime% · %Notes% · %LinkToActivity%
Deleting
Delete removes the selected rows and everything beneath them. If the selection includes a summary with children you are asked first and told how many activities will go — a row selected both in its own right and as part of a parent's subtree is counted once. A row with nothing under it goes on one click without a prompt.
After a delete the selection moves to the next activity at the same level; failing that the one before it; failing that the parent summary. Nothing is selected only once the project is empty.
Dragging, resizing and dependent activities
Drag a bar sideways to move it, or take its edge to resize it. Starts and ends snap to the whole hour, and a start landing in closed time moves forward to the next open slot.
Resizing changes only the activity you grabbed. Moving it may offer to carry the rest of the schedule: if the activity has children or successors you are asked whether the rest should shift by the same amount. Only activities that actually have something depending on them raise that question.
Grab a wide bar near its middle. Narrow bars are mostly made of their resize handles, so a drag on one tends to stretch it instead of moving it.
Double-click editor
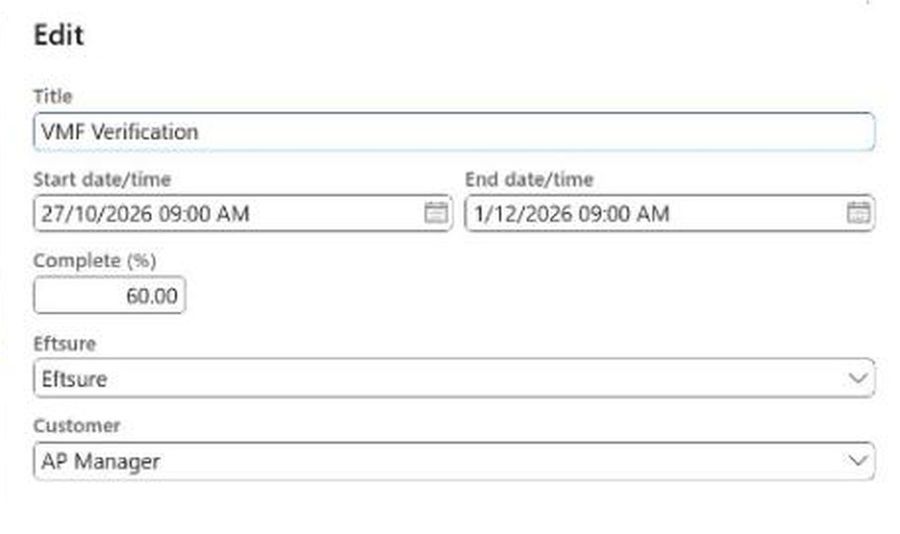
The activity editor
Double-click a bar to edit Title, Start date/time, End date/time, Complete (%), and the Eftsure and Customer owners without leaving the chart. Details opens the full Activities tab on this activity; Close returns to the chart.
An end that falls before its start is refused: the editor stays open, marks the field and says Invalid 'From' and 'To' date interval — a sentence, not a label id — as soon as the field is committed rather than on close. Double-clicking a summary collapses or expands it instead, and does so from the grid as well as the bar; an activity row in the grid opens the editor just as its bar does.
Changing Start date/time moves the activity: the end follows, the duration is kept, and if anything depends on it you get the same Activity has been moved, would you like to move all successor activities accordingly? prompt as a drag, clickable and with the same Yes/No. Changing End date/time behaves like a resize instead — successors stay where they are. There is no Cancel: each field writes as you leave it, so Close keeps what you typed and the chart redraws to match.
Zoom and time scale
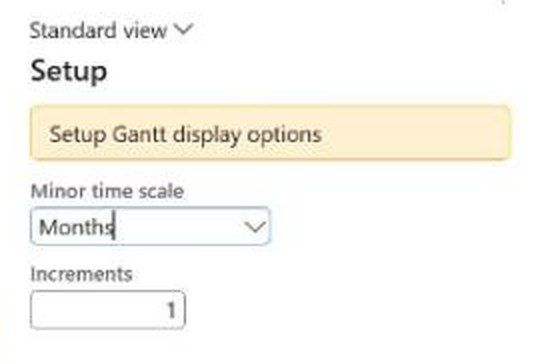
The time scale dialog
The zoom buttons step through the scales; the Time scale button sets it exactly. Minor time scale is the unit — hours, days, weeks, months — and Increments is how many of them each column covers.
Non-working time is shaded at hour, day and week zoom. At coarser scales nothing is shaded, because every column at that size contains some working time; snapping and the calendar warning still apply.
Styles and theme colours
By default every activity draws in the style assigned to it (Styles tab). Use theme colours replaces that with the project's accent colour and its light and dark variants — what you want for a customer-facing screenshot. While it is on, the Styles tab is hidden.
Optional activities
The methodology marks activities that not every customer needs as Optional. Show / Hide optional toggles them. Hiding changes only what the chart, the grid and the generated documents show; nothing is deleted.
Activities tab — the grid and the details pane
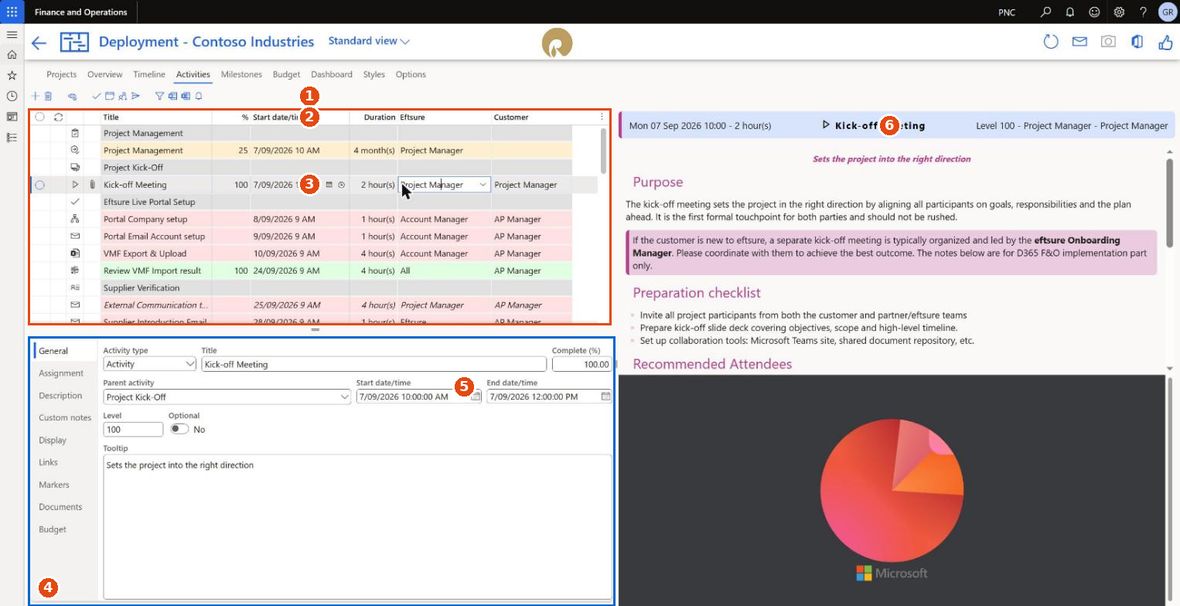
The Activities tab
| What it is | |
|---|---|
| 1 | The toolbar — the Timeline's actions plus filtering, exports and alerts |
| 2 | The activity grid: symbol, attachment indicator, Title, %, Start date/time, End date/time, Duration, Eftsure, Customer |
| 3 | The selected row |
| 4 | The details pane's vertical tabs — the eight sections below |
| 5 | The details of the selected activity |
| 6 | The preview pane: the activity's written guidance, or an attached document |
The toolbar adds three things the Timeline does not have: Filter grid; Export to Word and Export to Excel for the current selection; and Alerts, which creates a standard F&O alert rule on the activity table so you can be told when a date or an owner changes.
General — and the three kinds of activity
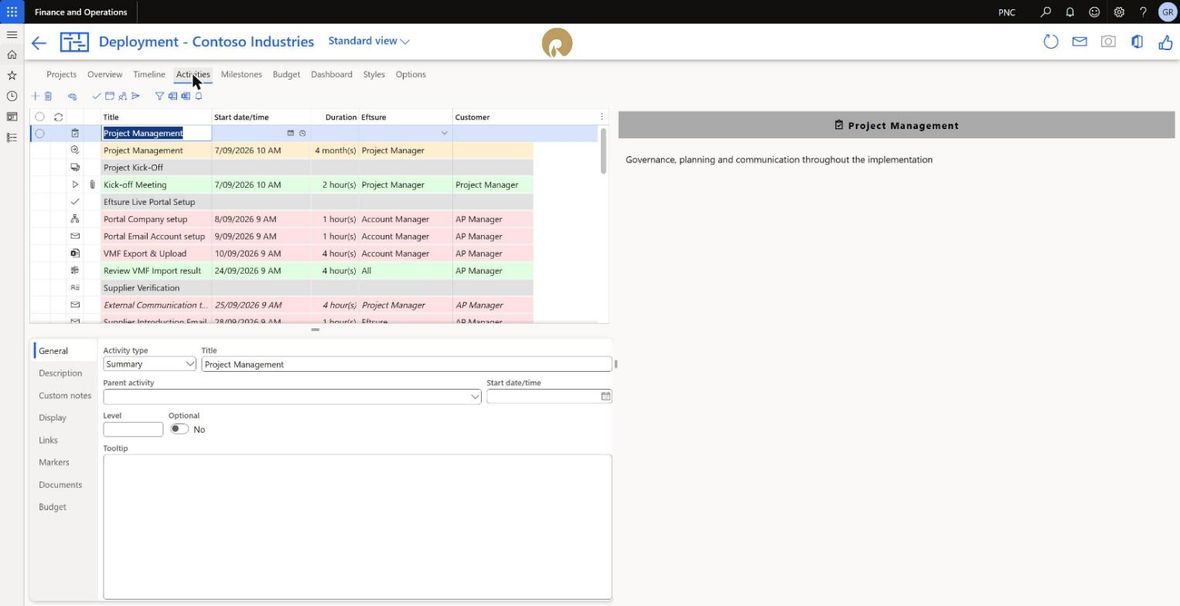
The General sub-tab
Activity type is the first field, and it is the one that changes everything else on this tab. There are three types and they are not interchangeable.
| Type | What it is | Has dates? | Has a completion %? | Has a budget? | Drawn as |
|---|---|---|---|---|---|
| Summary | A container — a phase, a workstream, a grouping. It has no dates of its own: its bar spans its children, and its completion and budget are rolled up from them | No, derived | Rolled up | Rolled up, read-only | A wide bar spanning its children, with the summary display options of Custom notes |
| Activity | A task somebody does. The normal case | Yes — start and end | Yes, you set it | Yes, you type planned and actual | A bar whose length is its duration |
| Milestone | A point in time. A deadline, a gate, a sign-off — something that either has happened or has not | A date only, no duration | No | No | A diamond or icon |
Three practical consequences:
- You cannot give a summary its own dates. If you want a phase to start on a fixed day, give it a child that does — or use a milestone.
- A milestone cannot be half done. If you find yourself wanting to put 50 % on one, it should be an activity.
- Changing the type of an existing activity is allowed, and the fields on this tab appear and disappear as you do it. A summary with children that you change to an activity keeps its children, which is rarely what you want — move them first.
The rest of the General tab:
- Title, Complete (%), Start date/time, End date/time.
- Parent activity — the supported way to move an activity. Pick a new summary and the row is re-filed under it, last among its children. The lookup lists only summaries, with their level, and excludes the activity's own descendants, so you cannot file something under its own child.
- Level — a free-text label the methodology uses to tag the effort or seniority a step needs (100, 200, 300…). It does not affect the hierarchy; indenting is what changes depth.
- Optional — the flag the Hide optional button acts on.
- Tooltip — the text shown when hovering the bar on the chart.
Assignment
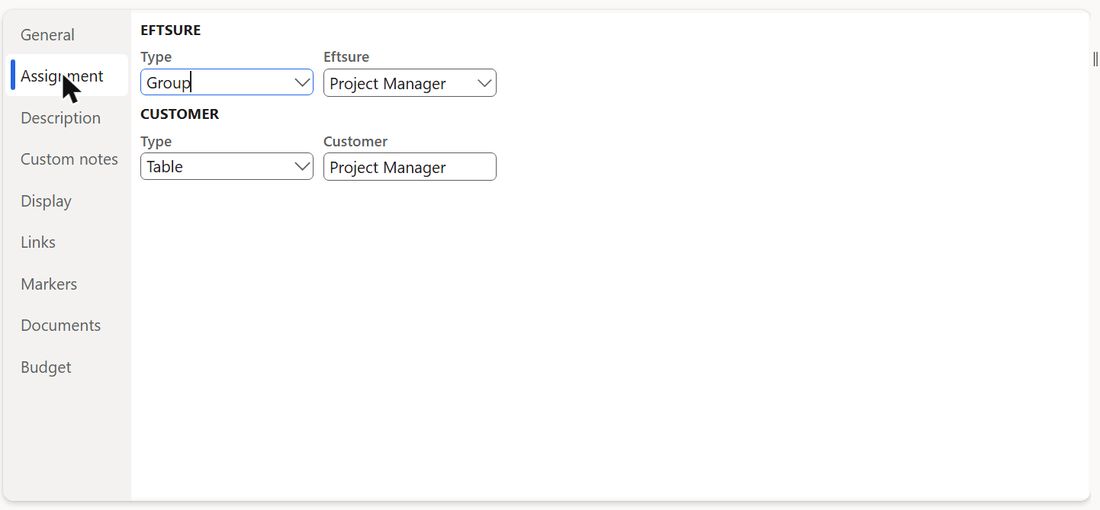
The Assignment sub-tab
Present only for an Activity. Two pairs: Eftsure (Type and value) and Customer (Type and value). Type chooses whether the value is a user, a user group or a table group. Changing the type clears the value beneath it.
On a generated project these arrive filled in from the Users tab of the creation dialog, which is why Project Manager and System Admin appear against the tasks in the demo screenshots.
Description
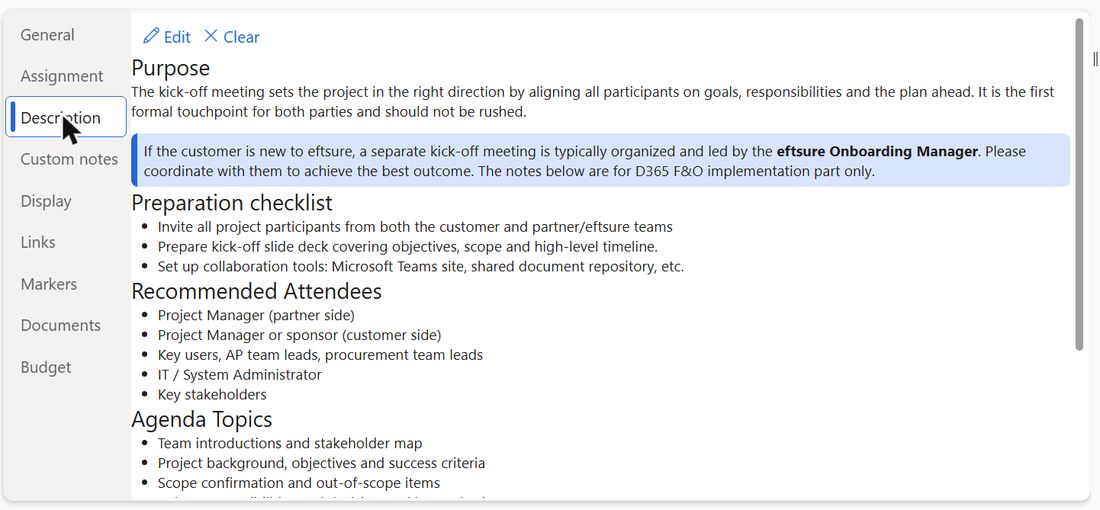
The Description sub-tab
The methodology's own written guidance for the step — purpose, preparation checklist, attendees, agenda, warnings. On a generated project this arrives filled in, and it is the single most valuable thing in the module for anyone running an implementation for the first time.
Edit opens the HTML editor (Writing in the HTML fields); Clear empties the field. The rendered result is what the preview pane on the right shows, and what the Word and HTML exports contain.
Custom notes
The Custom notes sub-tab
The same editor, for your own notes against this activity — what happened in the meeting, what the customer decided, what to watch for next time. Kept separate from Description so a methodology update never overwrites your notes.
Display — and what the row colours mean
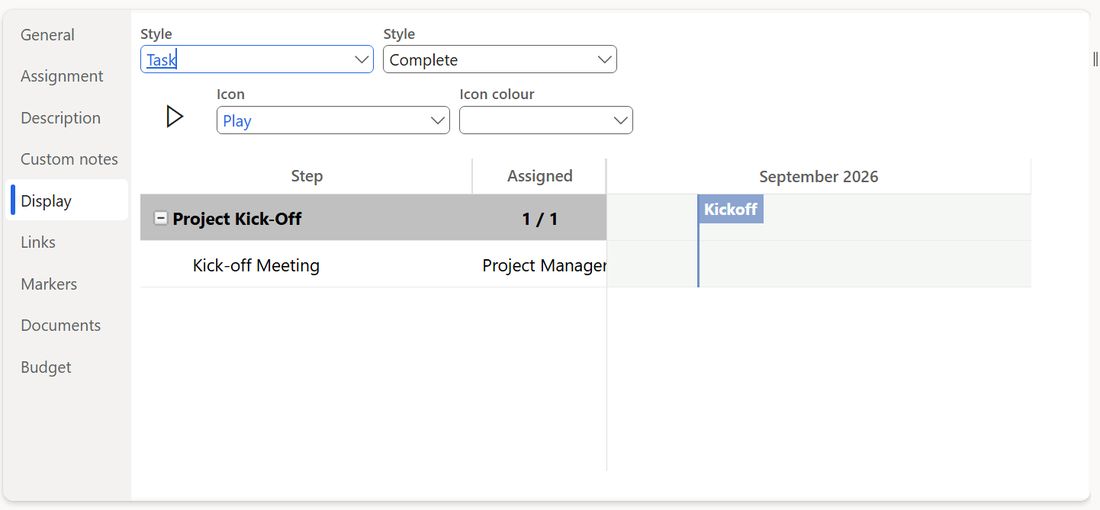
The Display sub-tab
- Style and Style when complete — which style the bar draws in, and what it switches to at 100 %.
- Show summary bar, Child style in summary, Summary type — how a summary is drawn (summaries only).
- Icon and Icon colour — the symbol on the bar, from the Eftsure symbol library.
- A live preview underneath.
Activities grid colour legend
The background colour of each row in the Activities grid is not the style — it is the activity's state, applied by the form. This is the legend:
| Row appearance | Means |
|---|---|
| Grey | A summary. Summaries are always grey regardless of progress |
| Green | An activity that is 100 % complete |
| Red / pink | An activity at 0 % — not started |
| Amber / orange | An activity in progress — anywhere between 1 % and 99 % |
| White with blue bold text | A milestone |
| Italic text (any colour) | The activity is marked Optional |
So in the demo project: Kick-off Meeting and Review VMF Import result are green because they are done, Portal Company setup is red because it has not started, and Project Management is amber because it is at 25 %.
The Budget tab uses a different legend, because there the question is money rather than progress:
| Row appearance | Means |
|---|---|
| Grey, bold | A summary (in Details view) |
| Green | Actual is at or under planned — on budget |
| Red | Actual has exceeded planned — over budget |
And the Hypercare tab is simpler still: amber for an open issue, green for a closed one.
The exact shades are the standard Eftsure status colours and are configured centrally in the Eftsure parameters, so if your environment's greens and reds differ from these screenshots, that is why.
Links — dependencies
The Links sub-tab
New and Delete, a To activity and a Type: finish-to-start, start-to-start, finish-to-finish or start-to-finish. Links draw as arrows on the chart and are what makes the "shift the rest of the schedule?" prompt appear when you move a predecessor.
Markers
The Markers sub-tab
Milestone markers attached to this activity — a dated label with a symbol and colour, drawn at the top of the chart. Distinct from the vertical markers on the Milestones tab, which belong to the project rather than to an activity.
Documents and Budget
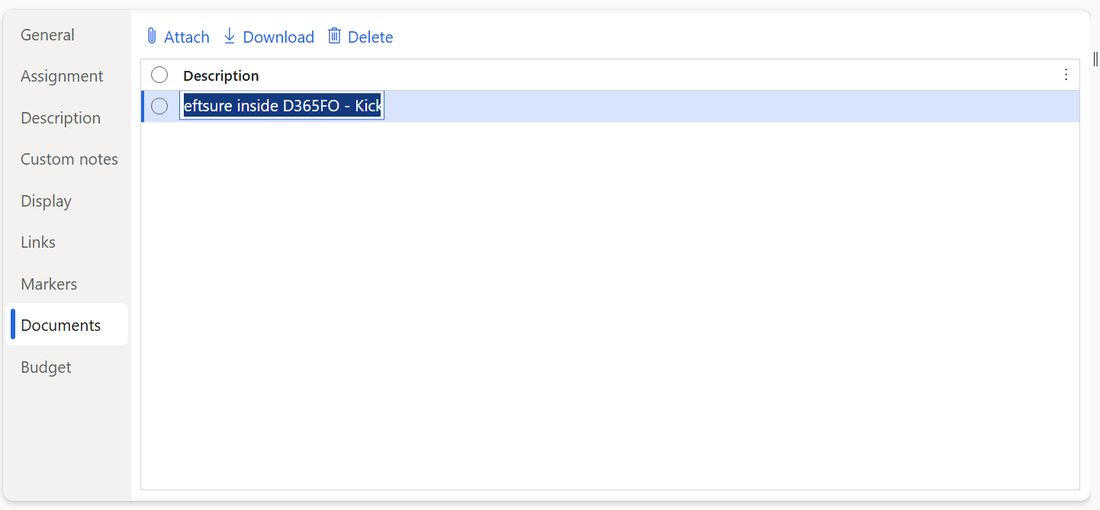
The Documents sub-tab
Documents: Attach, Download and Delete for files filed against the activity. An activity with an attachment shows a paperclip in the grid, and the file is previewed in the pane on the right. On a generated project some activities arrive with the methodology's own attachments — the kick-off sample agenda, for instance.
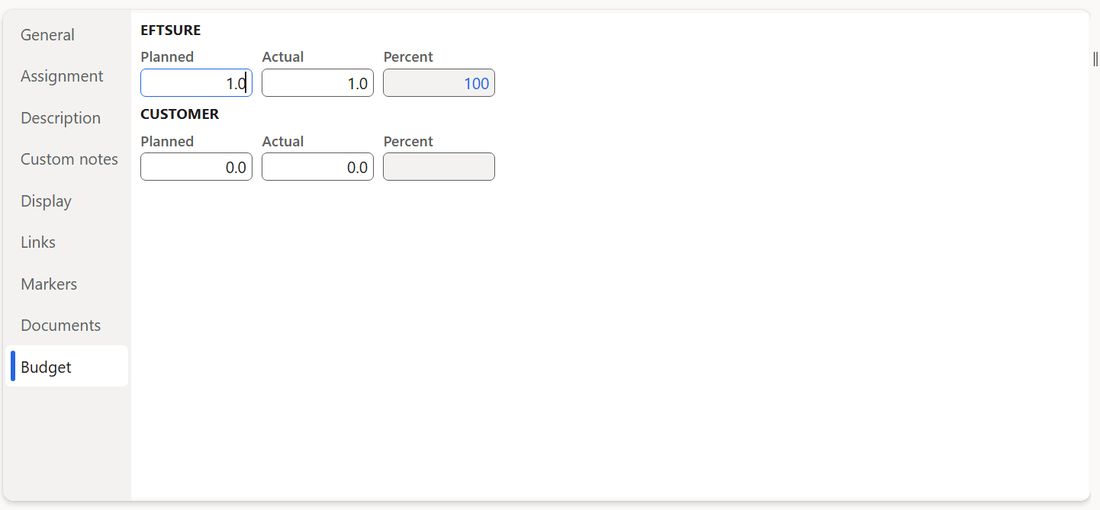
The Budget sub-tab
Budget: two groups, Eftsure and Customer, each with Planned, Actual and Percent. On a summary the figures are the roll-up of the children and are read-only; on an activity you type them. Percent is actual against planned.
Writing in the HTML fields
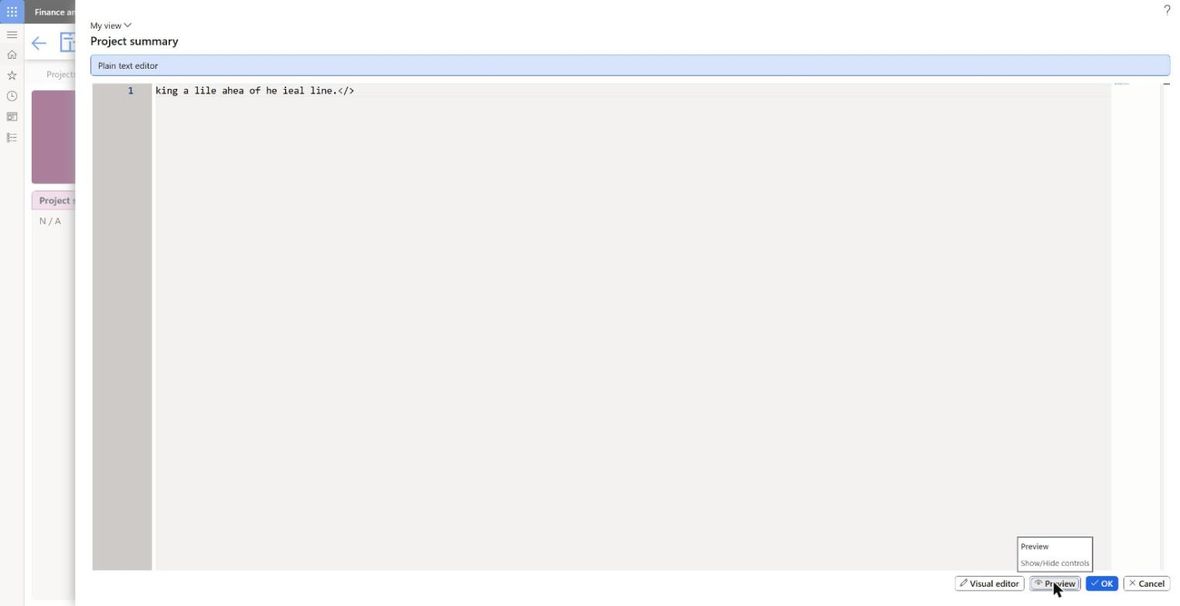
The HTML editor
Description, Custom notes, the project notes and the five Overview panels all use the same editor. It has two panes — a Plain text editor on the left where you write HTML, and a live HTML Preview on the right — plus Visual editor, Preview, OK and Cancel.
The methodology's own content uses a small, fixed vocabulary of classes. Use the same ones and your notes will look like the rest of the module — and will keep looking right if the styling changes.
Callouts
Four classes, each rendering as a coloured box with a left bar. Use them for the thing somebody will otherwise miss.
<div class="info">Background a reader needs, but nothing will break without.</div>

<div class="tip">A shortcut or a better way of doing the step.</div>

<div class="warning">Something that will cost time if ignored — a prerequisite,
a lead time, a step that cannot be undone easily.</div>

<div class="error">Something that will break the implementation. Do not skip.</div>
A real one from the kick-off activity:
<div class="info">If the customer is new to eftsure, a separate kick-off meeting is
typically organized and led by the <b>eftsure Onboarding Manager</b>. Please coordinate
with them to achieve the best outcome. The notes below are for D365 F&O
implementation part only.</div>
Headings, lists and emphasis
Plain HTML. The module styles h2 as a section heading inside the preview pane.
<h2>Purpose</h2>
The kick-off meeting sets the project in the right direction by aligning all
participants on goals, responsibilities and the plan ahead.

<h2>Preparation checklist</h2>
<ul>
  <li>Invite all project participants from both the customer and partner teams</li>
  <li>Prepare the kick-off slide deck covering objectives, scope and timeline</li>
  <li>Set up collaboration tools: Teams site, shared document repository</li>
</ul>

<b>Bold</b> for a term, <i>italic</i> for a file or field name.
Tables
Use the PESPreview class so the table picks up the module's own table styling. The first row is treated as the header.
<table class="PESPreview">
  <tr><td>Stage</td><td>Retry frequency</td><td>Max emails per supplier</td></tr>
  <tr><td>Verification</td><td>Every 1 day</td><td>2 (verification + intro)</td></tr>
  <tr><td>Reminder 1</td><td>Every 2 days</td><td>3 (Reminder 1 + 2 previous)</td></tr>
  <tr><td>Reminder 2</td><td>Every 2 days</td><td>4 (Reminder 2 + 3 previous)</td></tr>
</table>
Links
An ordinary anchor. Always set target="_blank" so the link does not navigate the F&O window away from the project.
<!-- external documentation -->
<a href="https://www.eftsureinsided365fo.com/docs/admin/export-vendor-master-file"
   target="_blank">VMF Export Guide</a>

<!-- the eftsure help desk -->
<a href="https://helpdesk.eftsure.com.au/hc/en-au/articles/27598792950035"
   target="_blank">Email Account Setup Requirements</a>

<!-- an email address -->
<a href="mailto:[email protected]">customer support</a>
Linking to a menu item — opening another F&O form
F&O deep-links by menu item in the query string: ?mi=<MenuItemName>&cmp=<company>. That makes it possible to send a reader straight to the form a step talks about instead of describing where to find it.
<!-- this module's own Projects form -->
<a href="?mi=PESProj&cmp=PNC" target="_blank">Open the project plan</a>
<!-- the activity form -->
<a href="?mi=PESProjActivity&cmp=PNC" target="_blank">Open the activity</a>
<!-- a standard F&O form - vendors -->
<a href="?mi=VendTable&cmp=PNC" target="_blank">Vendors</a>
<!-- fully qualified, for a link that will be read outside F&O -->
<a href="https://your-environment.operations.dynamics.com/?mi=PESProj&cmp=PNC"
target="_blank">Open the project plan</a>
Replace PNC with the legal entity the reader should land in, and remember to escape the & as & inside the HTML.
Status chips
The methodology uses these for inline verification-status wording. They render as small coloured chips.
<span class="PESStatusGreen">Verified</span>
<span class="PESStatusOrange">Awaiting response</span>
<span class="PESStatusRed">Failed verification</span>
<span class="PESStatusSelfCertified">Self-certified</span>
<span class="PESStatusAboveLimit">Above limit</span>
<span class="PESStatusSkip">Skipped</span>
Images
Images are embedded by the template generator at a fixed width class. In hand-written notes, an ordinary img with a width works:
<img src="https://…/screenshot.png" class="PESProjImageWidth50" alt="Supplier email">
PESProjImageWidth50 renders the image at half the pane width, which is the right size for a screenshot sitting beside text.
A worked example
Everything above, in the shape a methodology activity actually takes:
<h2>Purpose</h2>
Validate the vendor master file before the supplier outreach begins.
<div class="warning">The VMF must use the format
<b>LegalEntity|VendorAccount|BankAccountID</b>. A file in any other shape will be
rejected by the portal and the outreach will slip by a week.</div>
<h2>Checklist</h2>
<ul>
<li>Export the VMF — see the
<a href="https://www.eftsureinsided365fo.com/docs/admin/export-vendor-master-file"
target="_blank">VMF Export Guide</a></li>
<li>Check row counts against
<a href="?mi=VendTable&cmp=PNC" target="_blank">Vendors</a></li>
<li>Upload to the portal and confirm the import summary</li>
</ul>
<h2>What good looks like</h2>
<table class="PESPreview">
<tr><td>Check</td><td>Expected</td></tr>
<tr><td>Rows imported</td><td>Matches the D365 vendor count</td></tr>
<tr><td>Bank details present</td><td>Over 95 %</td></tr>
<tr><td>Status after 48h</td><td><span class="PESStatusGreen">Verified</span> rising</td></tr>
</table>
<div class="tip">Run the export twice a week apart during data cleansing — the delta
tells you whether the cleansing is actually landing.</div>
Milestones tab — vertical markers
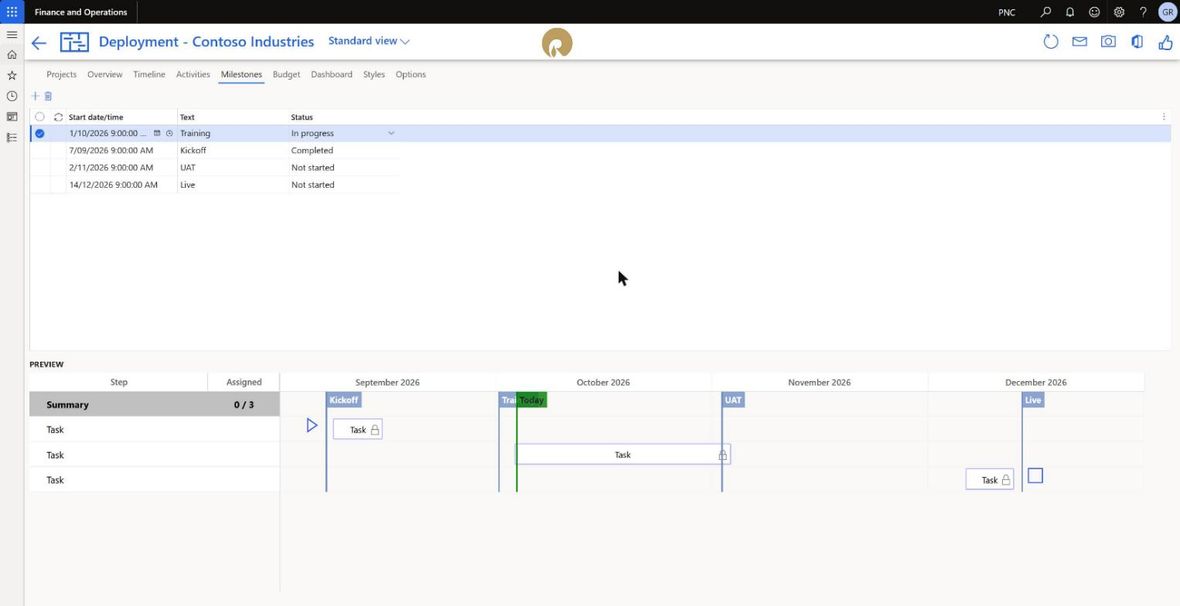
The Milestones tab
Vertical markers are the dated lines drawn across the whole chart — Kickoff, Training, UAT and Live on a generated project. Each has a Start date/time, a Text and a Status: Not started, In progress, On hold, Blocking issues or Completed. The status colours the line, and the Overview lists them all with the next one due picked out.
New marker and Delete are the only commands. The preview underneath shows how the marker sits against the plan.
Budget tab
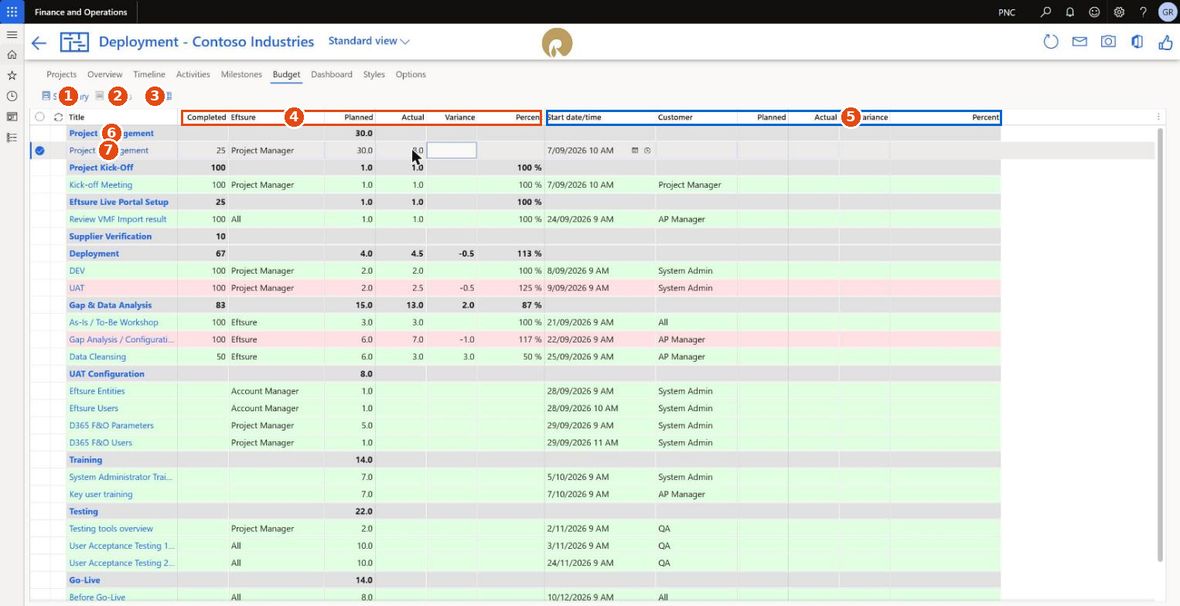
The Budget tab
| What it is | |
|---|---|
| 1 | Summary — show only rows that carry a budget |
| 2 | Details — show every activity |
| 3 | Filter grid and Export to Excel |
| 4 | The Eftsure column group: Planned, Actual, Variance, Percent |
| 5 | The Customer column group: the same four |
| 6 | A summary row with its rolled-up total in bold |
| 7 | An activity row |
Completed is the completion percentage, and it is editable here, so this tab doubles as the fastest way to update progress across many activities without going back to the chart — which is exactly how the demo project in this guide was driven to 25 %. On a summary row it is the average of its children's percentages, optional children included: a phase with four activities, one of them at 40 %, reads 10. That is worth knowing before you read a low number as bad news — a phase can sit at 10 % with its only real work already finished.
The money columns roll up the same way and re-add the moment an activity moves. Re-parent an activity carrying 5.0 planned and 3.0 actual and the old phase's figures drop to blank while the new phase gains 5.0 / 3.0 / 60 %, on this tab and on the Dashboard, with no refresh. The Dashboard's per-phase chart draws only the phases that carry a planned figure, so a phase whose activities have no budget is absent there while still appearing here.
Variance is planned minus actual; Percent is actual against planned. Rows over budget turn red — UAT in the screenshot is 2.5 hours against 2.0 planned, so it shows −0.5 and 125 %. The Details button at the far left jumps to the Activities tab on the selected row.
Dashboard tab
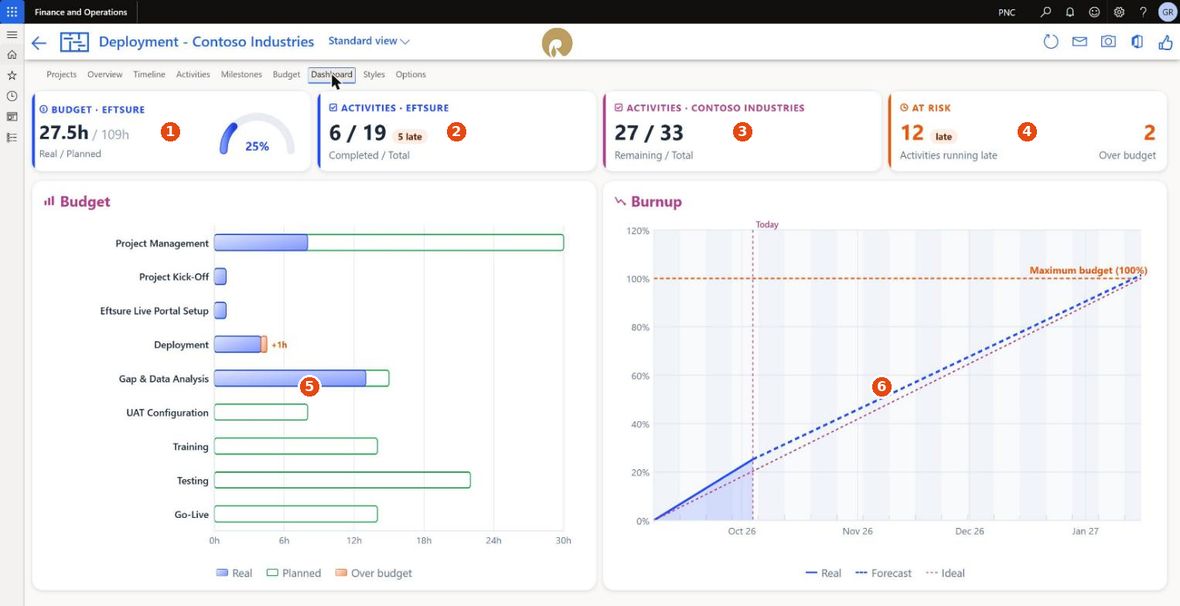
The Dashboard tab
| Tile or chart | Reads | |
|---|---|---|
| 1 | Budget · Eftsure | Actual against planned hours with a percentage dial — 27.5h / 109h, 25 % |
| 2 | Activities · Eftsure | Completed against total for Eftsure-owned activities, with a count of how many are late |
| 3 | Activities · \<customer> | Remaining against total for customer-owned activities |
| 4 | At risk | Activities running late, and activities over budget |
| 5 | Budget chart | Planned against actual per phase, with over-budget bars called out in orange |
| 6 | Burnup chart | Real against forecast against ideal, with today marked and a maximum-budget line |
The dashboard is the thing to screenshot for a steering committee — which is what the Screenshot button (Screenshots) is for.
Styles tab
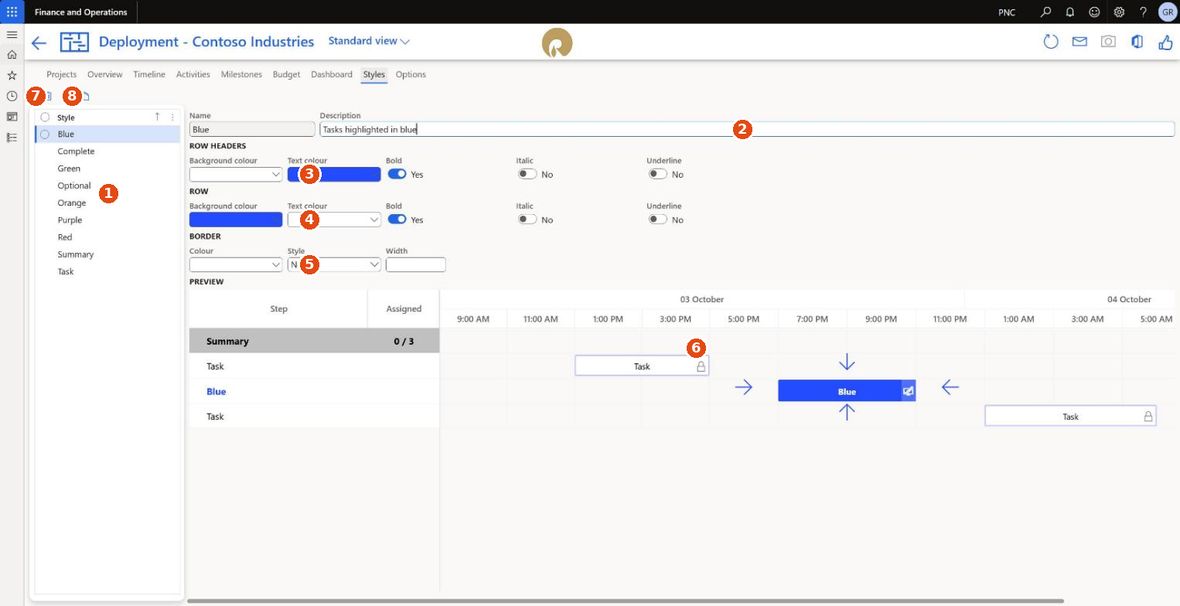
The Styles tab
A style is a named set of formatting that activities refer to by name. A generated project arrives with a standard set — Blue, Complete, Green, Optional, Orange, Purple, Red, Summary, Task.
| What it is | |
|---|---|
| 1 | The style list |
| 2 | Name and Description |
| 3 | Timeline left columns — how the row looks in the left-hand grid: background, text colour, bold, italic, underline |
| 4 | Calendar — the same five for the bar on the chart. Underline is the one to know about: a defect in the platform's Gantt control makes both halves of a style share a single underline flag, so the bar follows the Timeline left columns setting and its own checkbox has no effect until Microsoft fixes it |
| 5 | Border — colour, style and width of the bar's outline |
| 6 | A live preview |
| 7 | New style / Delete |
| 8 | Generate rebuilds the standard set; Copy to another project copies the selected styles to a project in this or another legal entity |
Because activities point at a style by name, changing a style restyles every activity using it at once — and a style copied into another project under the same name takes effect there immediately.
Note the division of labour: the style controls the bar on the chart, while the row background in the Activities grid is driven by state (Activities → Display). Changing a style will not change the green/amber/red of the grid.
Documents and Reports tabs
Both appear only when Archive generated documents is on (Options → Documents).
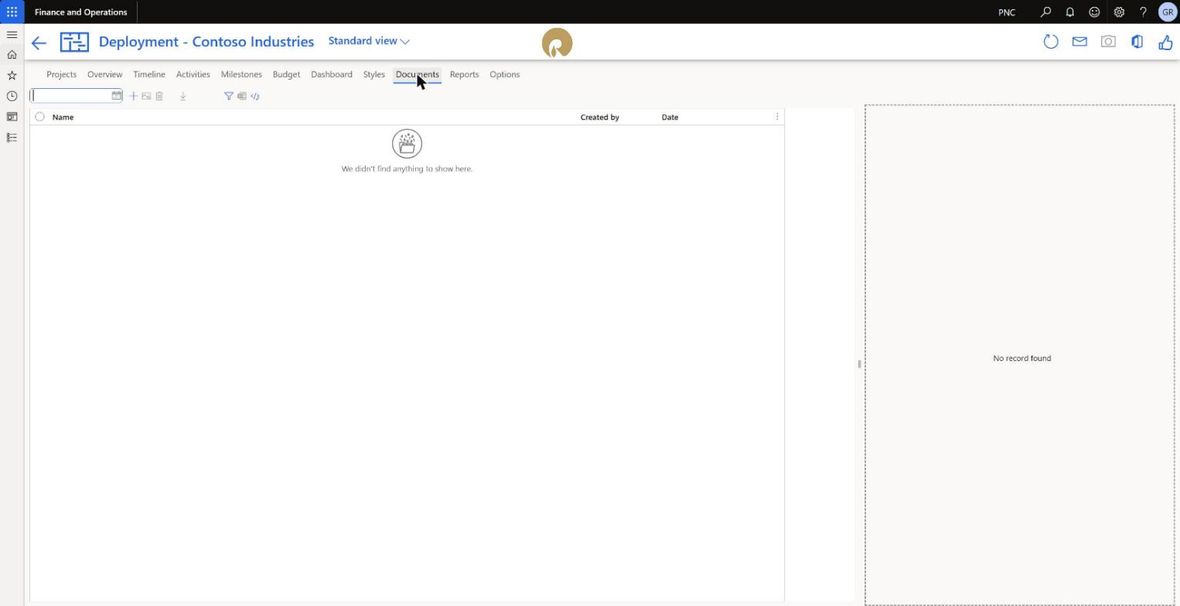
The Documents tab
Documents is the project's archive of screenshots and generated files, with a date filter at the top, New, the image editor, Delete, Download, Filter and Export to Excel. Select a row and it is previewed on the right.
This is where the Screenshot button files its output:

The Screenshot button in the window header
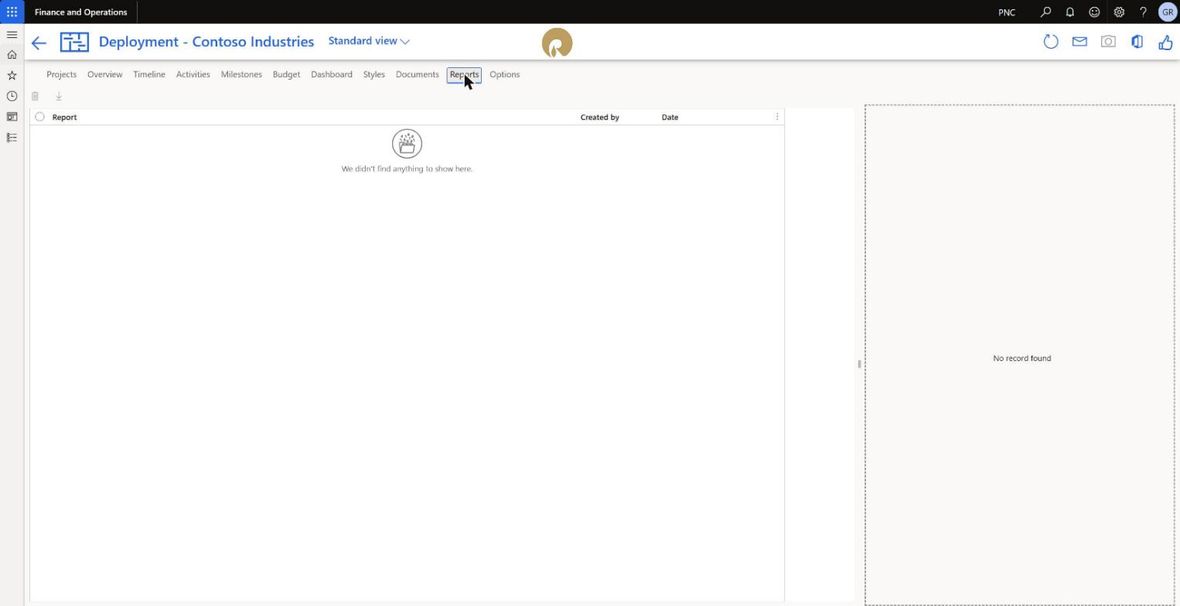
The Reports tab
Reports is the archive of generated status reports — type, report name, who generated it and when, with Delete and Download. Every status update email you generate leaves its report here, so the tab doubles as a history of what was sent and when.
Hypercare tab
Hypercare is the stretch after go-live when the implementation team stays close to the customer: the plan is finished, the system is live, and what is left is the run of small problems that only appear once real invoices and real suppliers are flowing. This tab is the log for that period — and, once the project is Completed, it is what the generated status documents report on.
The tab only exists while the project is marked Completed on the Projects tab. That is deliberate rather than awkward: hypercare begins where the plan ends. Ticking Completed swaps the working tabs (Overview, Activities, Milestones, Budget, Dashboard, Styles, Reports) for this one — the plan is done, so the module stops showing you the plan and starts showing you the aftermath.
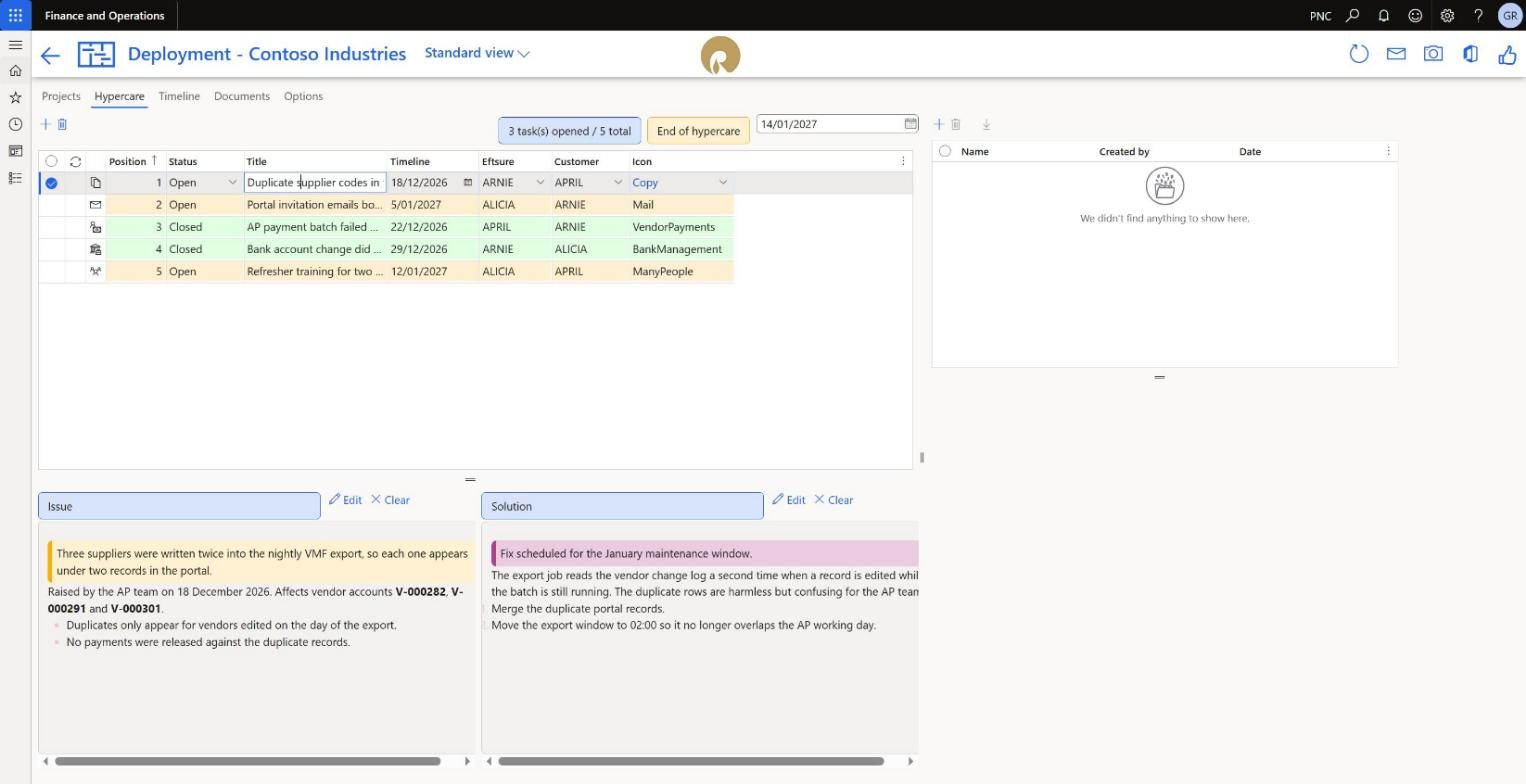
The Hypercare tab
Header
Two things sit above the list:
- A counter — n task(s) opened / m total. It recounts as you work, and it is the number worth reading first: the ratio, not the list length, is what tells you whether hypercare is converging.
- End of hypercare — the date the period closes. Set it when the project goes live, and it becomes the deadline everything in the list is measured against.
List
| Column | What it is |
|---|---|
| Position | The running order. Set automatically for a new entry and editable afterwards; the list always sorts by it, so Position is how you rank by urgency without a priority field. |
| Status | Open or Closed — the only two values. This drives the counter and the row colour. |
| Title | One line describing the issue. Keep it short; the detail belongs in Issue. |
| Timeline | The date the entry is pinned to — when it was raised, or when it is due. |
| Eftsure | The Eftsure-side owner, picked from the user list. Unlike an activity, which carries a role, a hypercare entry names a person — during hypercare you want someone, not a job title. |
| Customer | The customer-side owner, picked the same way. |
| Icon | A symbol from the module's library, shown at the left of the row. |
What the row colours mean

The Hypercare row colours
The background of a row is its status, nothing else:
| Colour | Means |
|---|---|
| Amber | Open — still outstanding |
| Green | Closed — resolved |
| Blue | The row you have selected. Selection wins over status, so the current row does not show its colour. |
These are the shared Eftsure status colours configured centrally in the Eftsure parameters (Parameters that affect this module), so the amber and green here are the same amber and green as in the Activities grid (Activities tab → Display — and what the row colours mean) and the Budget grid. Change them there and this list follows.
The colour is applied as the grid draws a row, so on builds before this fix, flipping Status did not repaint the row until something else redrew the grid — a closed issue stayed amber until you refreshed the form. A research() on the data source after the save now repaints it, so the row turns green as the change is committed.
Issue and Solution
Selecting an entry fills the two panes at the bottom of the tab. Issue is what went wrong; Solution is what was done about it. Both are rich-text fields using the same HTML editor as the activity Description and Custom notes (Writing in the HTML fields), with the same Edit and Clear buttons and the same vocabulary of callouts, tables, lists and links — so an issue can carry a warning box, the affected account numbers in bold, and a numbered remediation plan, rather than a wall of plain text.
The panes appear only when an entry is selected, and they render exactly what the generated documents will carry. If you are writing for a customer who will read the Word pack, write it here rather than in an email.
Attachments
The pane on the right is the entry's own document list — a screenshot of the error, the support ticket, the corrected file. It works like the Documents sub-tab on an activity: attachments belong to the hypercare entry, travel with it in a DMF package (PESProjHypercareAttachment), and are kept separately from the project's own documents.
Symbol picker
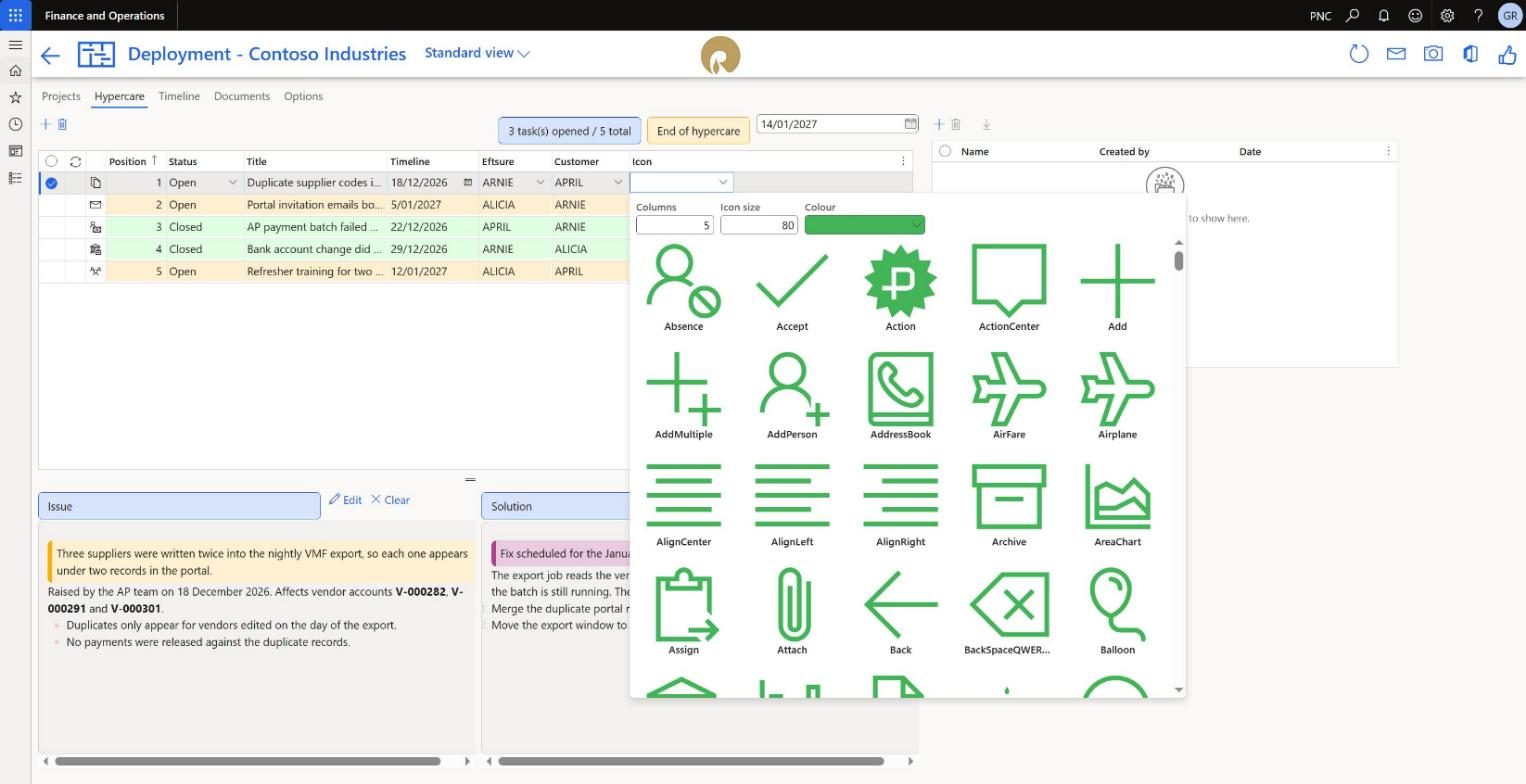
The symbol picker
The Icon column, and every other symbol field in the module, opens the same picker: a searchable grid of the module's icon library with Columns, Icon size and Colour controls above it. Type to filter by name — Bank, Mail, People, Pay — and click to choose. The colour swatch applies to the symbol, not the row.
What hypercare does to the generated documents
This is the part that is easy to miss. Once the project is marked Completed, the generated Office documents report on the hypercare log rather than on the plan. The same Word, Excel and PowerPoint exports (Exporting projects, What the four attachments look like) keep their structure, but the content they fill with becomes the hypercare entries — titles, status, dates, the two owners, and the Issue and Solution text written in the panes above.
In practice this means the weekly rhythm does not change at go-live. Before go-live, one click produces a status pack about the plan; after go-live, the same click produces a status pack about the open issues — who owns each one, what has been closed since last week, and how many remain against the end-of-hypercare date. That continuity is the point: the customer keeps receiving the same document, and it keeps answering the same question.
Hypercare is also a data entity in its own right (PESProjHypercareEntity), so the log can be exported to Excel directly through Open in Microsoft Office or extracted with the rest of the project in a DMF package.
Options tab
Contacts
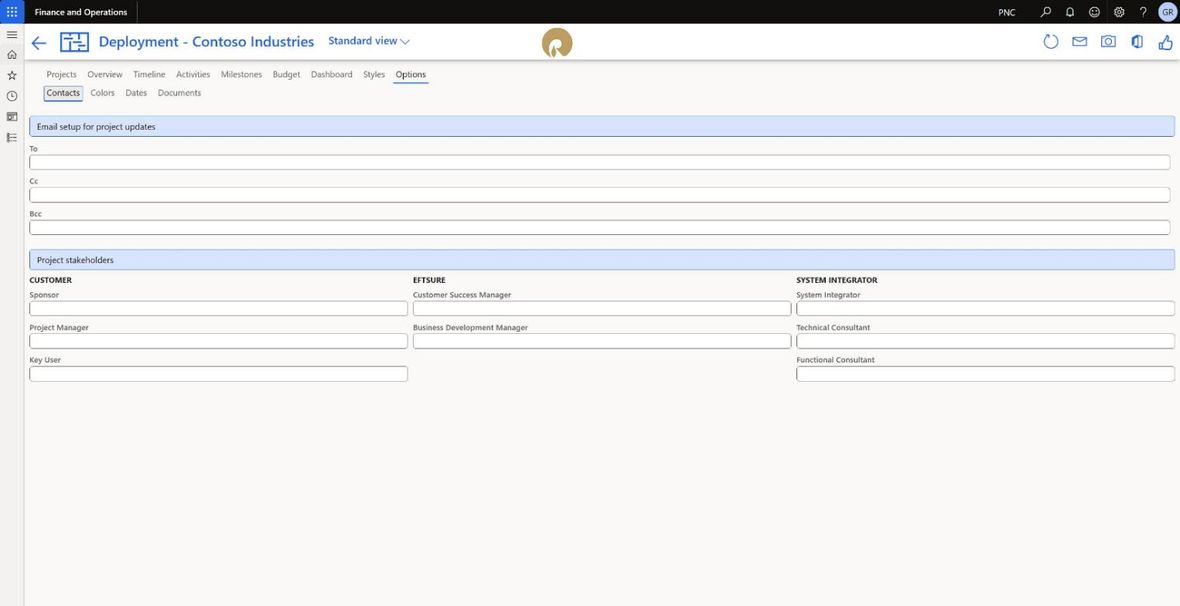
Options — Contacts
The To, Cc and Bcc fields under Email setup for project updates are not reference data — they are the address lines the envelope button in the window header (Status update email) puts on the draft it creates. Nothing else reads them, and the email button has nowhere else to look, so an empty To means a draft addressed to nobody.
Fill them in once, when the project is created, and the weekly update becomes a single click for the rest of the implementation. Review them whenever people join or leave the project — the draft opens addressed from this list every time, so a stale name here is a stale name on every status update until someone notices.
Email setup for project updates — the To, Cc and Bcc lists the status update email is addressed to, as above. Separate multiple addresses the way your mail client expects.
Project stakeholders — names in three columns. Customer: Sponsor, Project Manager, Key User. Eftsure: Customer Success Manager, Business Development Manager. System Integrator: System Integrator, Technical Consultant, Functional Consultant. Free text, used in generated documents rather than for security.
Colors

Options — Colors
Accent color, with Generate variations to derive the light and dark shades from it, and a Colour theme picker of pre-built palettes. The accent colour drives the Overview banner, the dashboard and the generated documents. On a project created with the logo finder these arrive derived from the logo.
Dates

Options — Dates
Date format and Calendar, the same two settings offered at creation, editable afterwards. Changing the calendar changes what counts as working time from that point on; it does not reschedule activities that already exist.
Documents

Options — Documents
- Archive generated documents — file every generated document and screenshot against the project. Turning it on reveals the Documents and Reports tabs.
- Icons — draw activity symbols on the chart and in the grid.
Getting the plan out of D365
Status update email

The Generate status update email button
One click on the envelope assembles the weekly status update and opens it as a draft, addressed to the To, Cc and Bcc lists from Contacts. This is what it produces:
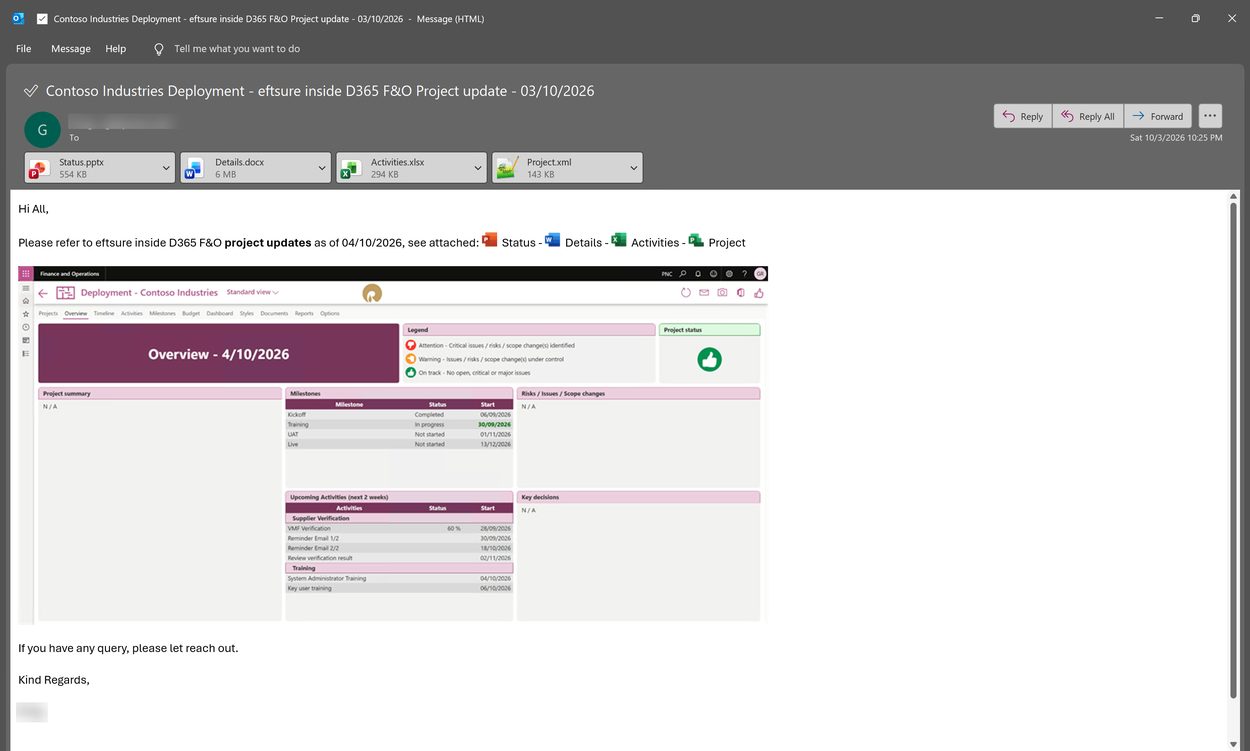
The generated status update email
What is in it
| Part | Contents |
|---|---|
| Subject | <Project name> <Type> - eftsure inside D365 F&O Project update - <date> — in the example, Contoso Industries Deployment - eftsure inside D365 F&O Project update - 03/10/2026 |
| Greeting | Hi All, |
| Lead line | Please refer to eftsure inside D365 F&O project updates as of \<date>, see attached: followed by the four attachments named inline with their Office icons — Status, Details, Activities, Project |
| Body image | The Overview tab rendered as a picture, inline in the email: the title band in the project's accent colour, the legend, the project status symbol, the project summary, the milestone table with statuses and dates, the upcoming activities for the next fortnight, and the risks and key-decisions panels |
| Sign-off | If you have any query, please let reach out. / Kind Regards, / the sender |
The four attachments — What the four attachments look like walks through all four in detail.
| File | What it is | Typical size |
|---|---|---|
| Status.pptx | The PowerPoint status deck — the steering-committee pack | ~550 KB |
| Details.docx | The full plan as a Word document, phase by phase, including each activity's written guidance. The largest of the four because it carries the methodology text and images | ~6 MB |
| Activities.xlsx | The activity list as a spreadsheet — dates, owners, completion, budget | ~300 KB |
| Project.xml | An MS Project file, for a customer PMO that keeps its own plan | ~150 KB |
So a single click produces a mail that works for every audience at once: the inline picture for people who will only read the email, the deck for the steering committee, the Word document for anyone who needs the detail, the spreadsheet for the PMO and the MS Project file for a customer who tracks in their own tool.
The email is a draft. Two things are worth a look every time:
- The recipients. They come from the lists on Contacts, not from whoever happens to be in the room.
- The inline picture, which is the Overview as it stands now. The free-text panels (Overview tab) are part of that picture, so an Overview with
N / Ain the summary and risks panels goes out that way.
Fill the Overview in first. That is the five minutes that makes the rest automatic.
A copy of the generated report is filed on the Reports tab (Documents and Reports tabs).
Screenshots

The Screenshot button
The camera button captures what is on screen and files it on the Documents tab, where it can be annotated with the built-in image editor and downloaded. It is the quickest way to get a dated snapshot of the chart or the dashboard into a status pack, and because it is filed against the project you end up with a visual history of how the plan changed.
The picture is taken by the browser rather than by the server, so the first capture in a session puts up the browser's own Choose what to share dialog. Pick this tab and press Share. The module then takes its three shots — Overview, Timeline and Dashboard — and the dialog usually stays away for the rest of the session.
That dialog lives outside the page, and while it is unanswered the project window is deliberately inert: the action panes are disabled so that nothing moves under the camera. A window that looks frozen almost always means the dialog is waiting somewhere you have not looked — behind the main window, or on another monitor.
What the four attachments look like
The same files come out of Save → MS PowerPoint / MS Word / MS Excel / MS Project (Exporting projects) and ride along with the status email (Status update email). They are generated from templates, so a partner can rebrand them without touching code — but the structure below is what you get out of the box.
Status.pptx — the steering-committee deck
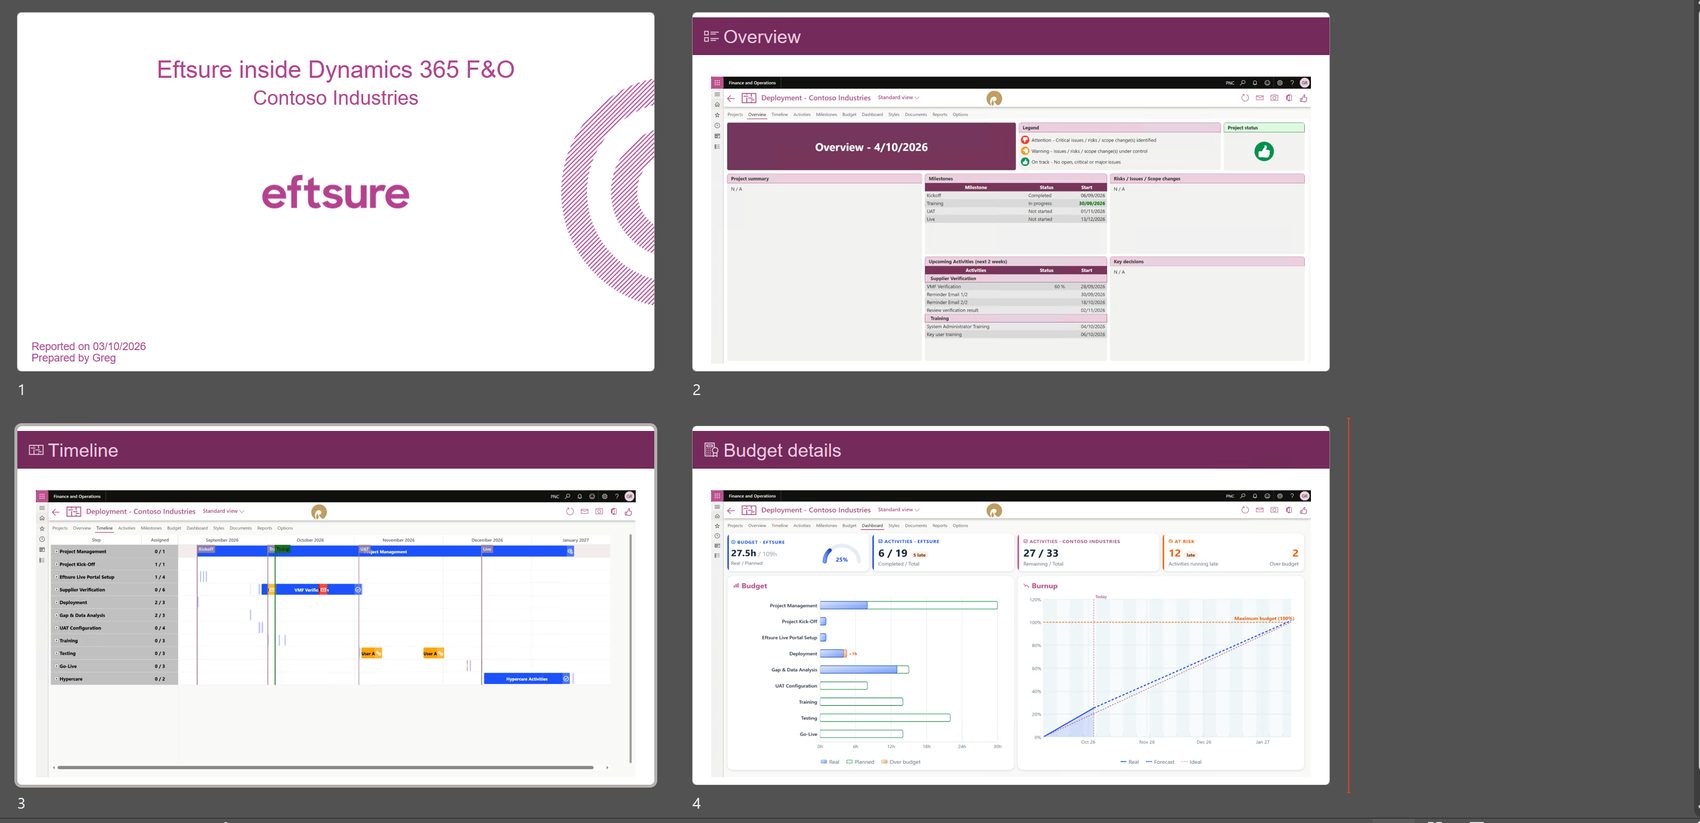
The PowerPoint export, Status.pptx, in Slide Sorter view
Four slides, in this order:
| # | Slide | Contents |
|---|---|---|
| 1 | Title | Eftsure inside Dynamics 365 F&O, the customer name, the eftsure logo, and a footer reading Reported on \<date> / Prepared by \<user> |
| 2 | Overview | The Overview tab rendered as a picture — the dated title band, the legend, the project-status symbol, the project summary, the milestone table with status and start date for Kickoff / Training / UAT / Live, the next fortnight's activities grouped by phase, and the risks and key-decisions panels |
| 3 | Timeline | The Gantt chart as drawn, including the Step and Assigned columns, the phase bars, the vertical markers and the activity icons |
| 4 | Budget details | The Dashboard — the four headline tiles (budget real/planned with its percentage ring, eftsure activities completed/total, customer activities remaining/total, and the at-risk count split into late and over budget), the per-phase budget bar chart, and the burnup chart with its forecast and ideal lines |
Slides 2 to 4 are images of the live tabs, so what you see on screen is exactly what lands in the deck. Fill the Overview's free-text panels before you generate, or slide 2 goes out saying N / A.
Details.docx — the full plan
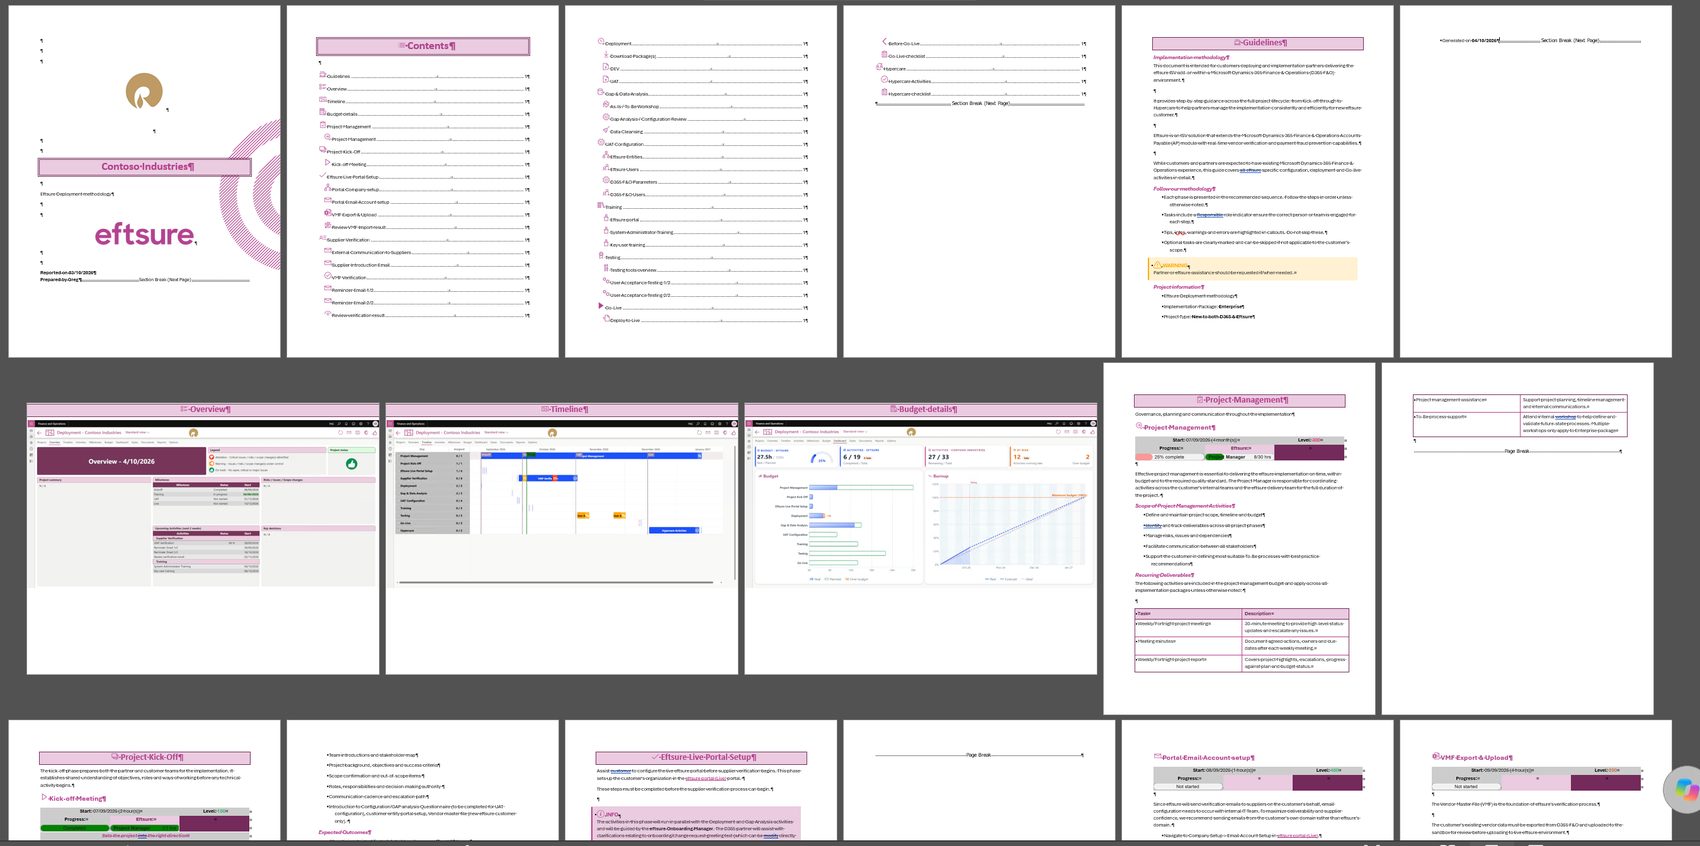
The Word export, Details.docx, in multi-page view
The long one — around 57 pages and 6,500 words for a standard deployment, because it carries the whole methodology text:
| Section | Contents |
|---|---|
| Title page | Customer name, Eftsure Deployment methodology, the logo, Reported on / Prepared by |
| Contents | A hyperlinked table of contents, one line per phase and per activity, each with the activity's own icon beside it |
| Guidelines | Implementation methodology — what the document is and who it is for; Follow our methodology — the rules of the road (keep the phases in order, the responsible role on every task, do not skip the tips and warnings, optional tasks are marked); a warning callout pointing at partner support; and Project information, which records the methodology, the implementation package and the project type this plan was generated from |
| Overview / Timeline / Budget details | The same three rendered pictures as slides 2–4 of the deck |
| One section per phase | A heading per phase, then a block per activity: a banner carrying Start, duration, a Progress bar, the eftsure and customer assignees and the methodology Level, followed by the activity's written guidance — expected outcomes, bulleted deliverables, tables of recurring deliverables, and the info / tip / warning callouts from the Description field |
| Footer | Generated on \<date> |
This is the document to send to anyone who has to do the work; the deck is for anyone who only has to approve it.
Activities.xlsx — the plan as data
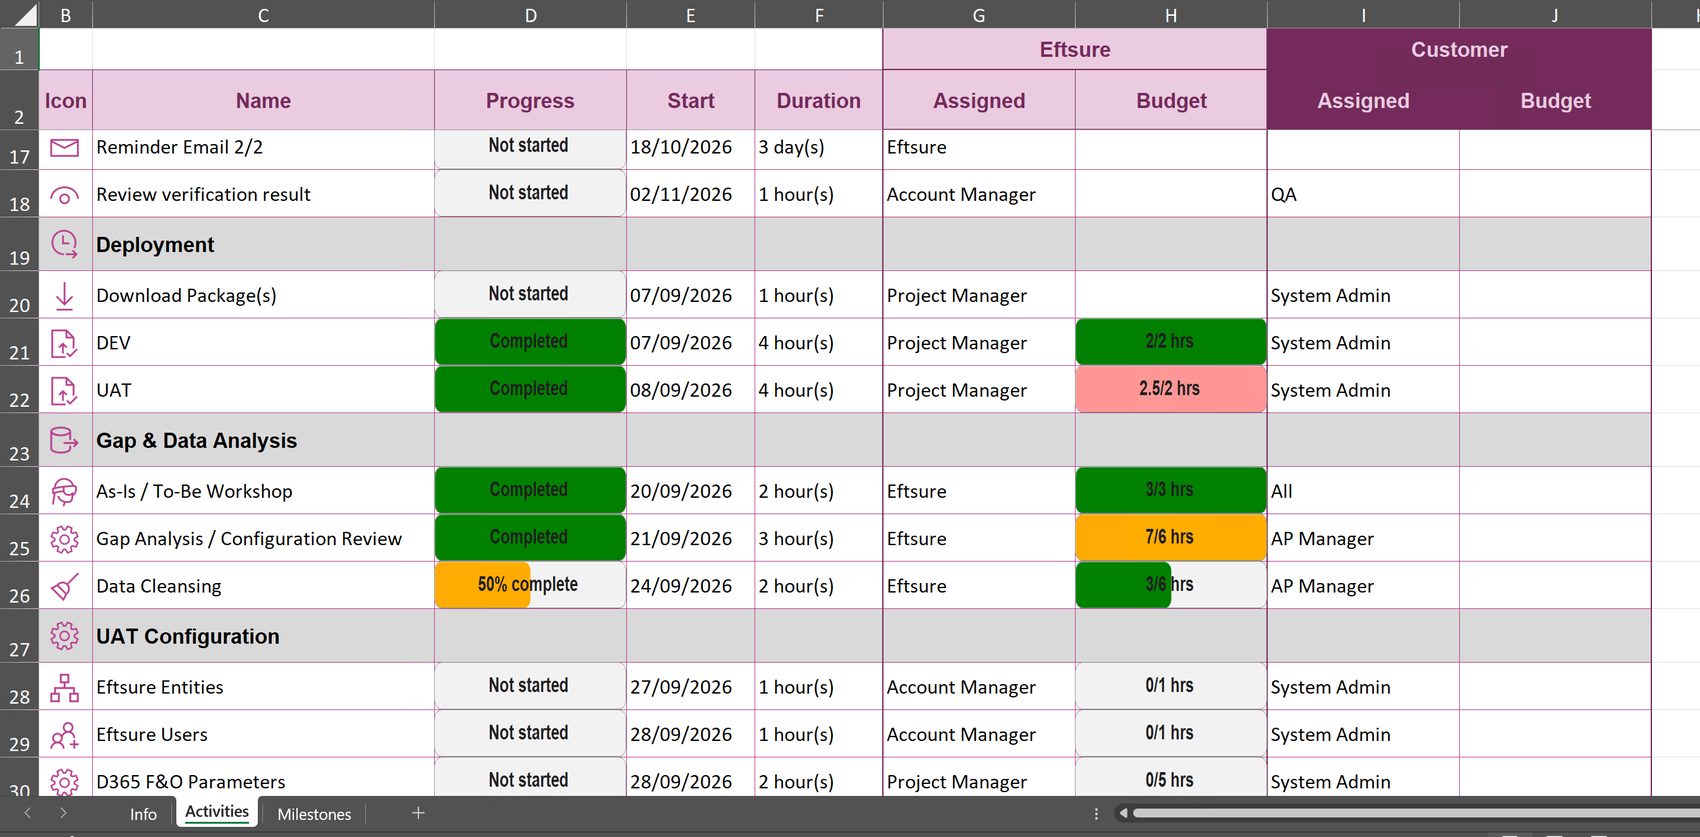
The Excel export, Activities.xlsx, showing the Activities sheet
Three sheets — Info, Activities and Milestones. The Activities sheet is the one that gets used:
- A two-level header: Icon, Name, Progress, Start and Duration stand alone, then two column groups — Eftsure (Assigned, Budget) and Customer (Assigned, Budget) — banded in the accent colour so you can tell at a glance which side of the engagement a row belongs to.
- Summary rows are shaded grey and bold, with their phase icon, and the activities below them are indented by name.
- Progress is a chip, not a number: green Completed, amber n% complete, pale Not started — the same reading as the Activities grid (Activities → Display), so the spreadsheet and the screen agree.
- Budget is written
real / planned hrsand colour-coded on the same scale: green while the real figure is still inside the plan, amber and red as it goes past it. A blank budget cell means no budget was set for that activity.
It is a flat list rather than a model — there are no formulas and nothing feeds back into D365. For a round trip, use Open in Microsoft Office (Project window → Five buttons in the top right corner) or the DMF package (Exporting projects).
Project.xml — the plan for a customer PMO
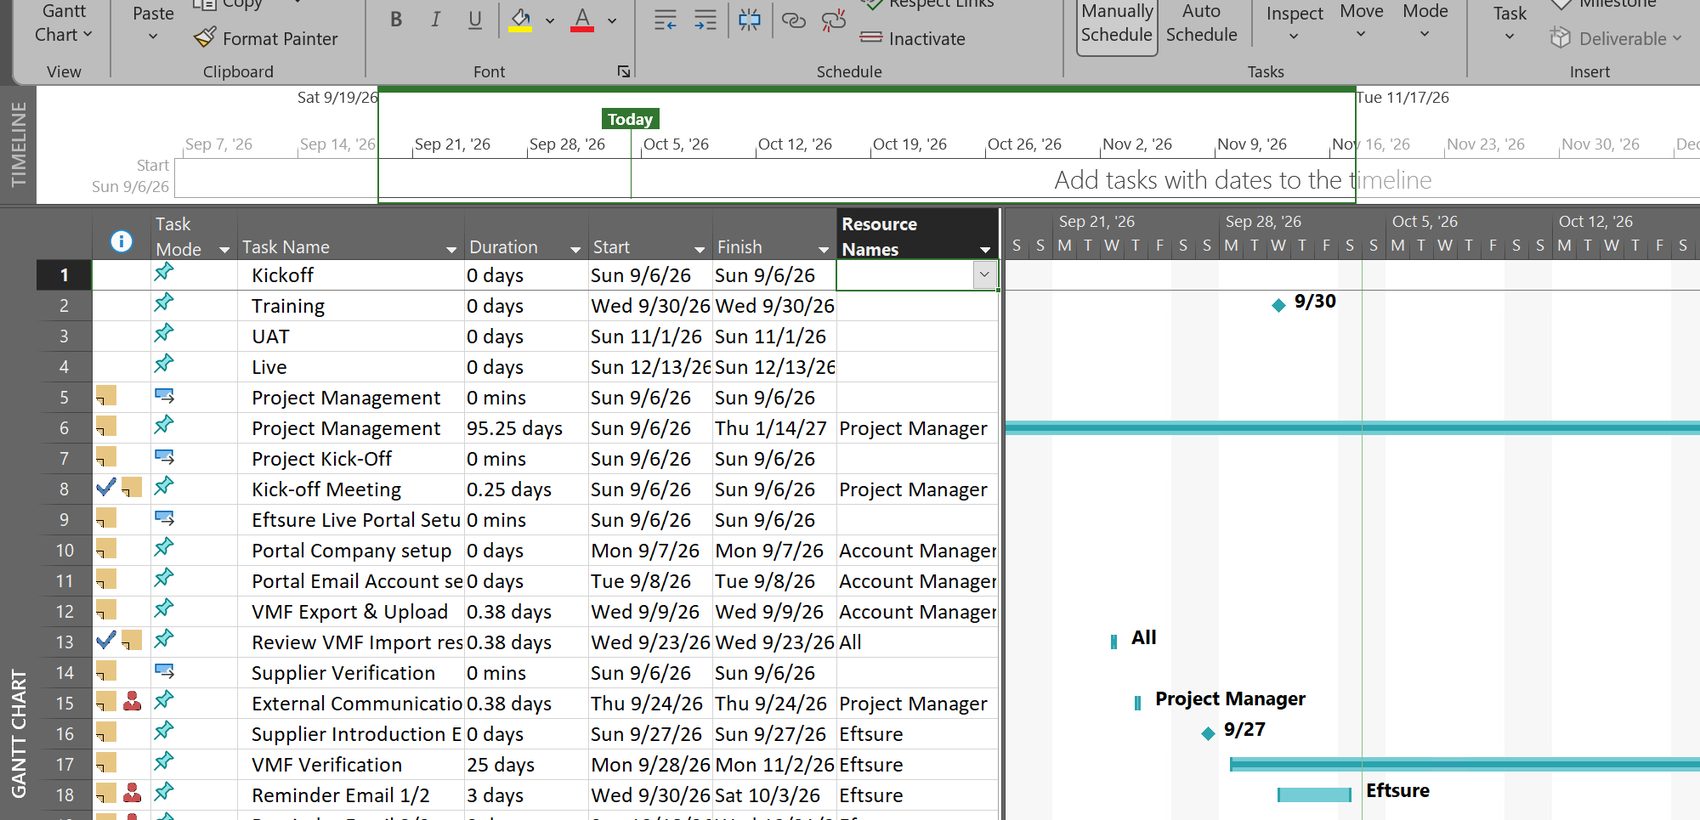
The MS Project export, Project.xml, opened in Project Professional
Not an Office document but the most useful of the four to a customer who runs their own PMO: a real MS Project file, opened here in Project Professional. What crosses over:
| Carried across | How it arrives |
|---|---|
| Task list and hierarchy | Every activity, with the methodology's phases as summary rows and their activities beneath |
| Durations | In MS Project's own units, so a quarter-day activity reads as 0.25 days and a zero-length one as 0 days |
| Start and finish | The dates from the plan, unchanged |
| Milestones | The four vertical markers — Kickoff, Training, UAT, Live — as zero-duration tasks, drawn as diamonds on the chart |
| Resource names | The owner roles — Project Manager, Account Manager, Eftsure, All — as MS Project resources, shown beside each bar |
| Completion | Finished activities carry their tick in the indicator column |
Two things to know before you hand it over. Tasks arrive manually scheduled — the status bar reads New Tasks : Manually Scheduled — so the dates are the ones this module calculated rather than ones MS Project worked out from links and calendars; the customer's PM can switch them to auto-scheduled, but the schedule will then be theirs to maintain, not yours. And the export is a snapshot: nothing flows back. Re-export when the plan moves rather than trying to reconcile two copies.
Everything else
Exporting projects covers the export formats; Open in Microsoft Office (Project window → Five buttons in the top right corner) covers Excel round-tripping; Export to Word and Export to Excel on the Activities and Budget tabs cover the current selection.
Setup
Deploying the module
Eftsure Project Management ships as its own deployable package, separate from the main Eftsure module. That separation is deliberate — not every customer wants the project workspace — but it carries one rule that matters more than anything else in this section.
The Project Management package version must match the version of the main Eftsure module installed in the environment. The two are built and released together, and the project module depends on code, labels, symbols, parameters and status colours that live in the main module. A mismatched pair will fail to deploy, or — worse — deploy and then misbehave in ways that look like data problems.
Check the version of the main Eftsure module first, then take the Project Management package carrying the same version. Upgrade them together, in the same deployment, every time. If you upgrade the main module, upgrade this one in the same window.
The methodology Version column on the Projects tab (Projects tab) is a different number — it records which version of the methodology template a project was generated from, not which version of the module is installed. Both are worth knowing; do not confuse them.
Where the packages come from
| Form | What it is | Where you get it |
|---|---|---|
| LCS package | Published into the LCS Asset library, reached by invitation to the Eftsure LCS Solutions | Directly from LCS, once your project has been invited |
| Software deployable package | A compressed zip containing application metadata, binaries and source-code updates — the classic F&O deployable package | The self-service download index on the releases site |
| Unified package | The deployment format used by modern Unified Developer Environments (UDE) and Power Platform-integrated systems | The self-service download index on the releases site |
A software deployable package can be converted to a Unified package with the ModelUtil command-line utility, found in C:\AOSService\PackagesLocalDirectory\bin on a developer machine.
Verify what you downloaded
Deployment order
- Confirm the version of the main Eftsure module in the target environment.
- Download the matching Project Management package, in the form your environment takes (LCS, deployable or unified).
- Deploy to a sandbox first, never straight to production.
- Run a full database synchronisation — this release changes the clustered index on the activity table (Upgrading).
After deployment
- Assign the security duties (Security) to the roles that need them.
- Decide whether a shared working calendar is needed (Working calendars) or the Monday-to-Friday default will do.
- Generate one project from each methodology type you expect to use and check it looks right before a customer sees it.
Methodology template
A deployment project is not hard-coded: it is generated from a template shipped with the model. The generator reads three inputs — the implementation package, the project type and your three milestone dates — and builds the plan from them.
What it produces for each project:
- the phase summaries and their activities, with the written guidance already attached,
- the dependencies between them,
- the four vertical markers (Kickoff, Training, UAT, Live),
- the standard style set,
- the Project Management phase, spanning the whole project,
- the Optional flag on every activity the chosen package does not require,
- the owner roles from the Users tab, applied across the plan.
The template records which methodology version a project came from — the Version column on the Projects tab. It lets you tell at a glance which projects predate a methodology change.
Three narrower generators share the same machinery: Entity, Upgrade and DB Refresh (Five kinds of project).
Working calendars
If a project has no calendar of its own, the module uses a shared default: Monday to Friday, 09:00 to 17:00. The calendar governs three things — the shading on the chart, where a dragged activity is allowed to start, and the warning the chart raises when a span has fewer than ten open days.
Two limits before you plan a long project:
- The shared calendar generates three years forward from the earliest activity it is asked about. A plan running past that needs a calendar of its own, maintained in the standard F&O calendar setup.
- Nothing is shaded at week zoom or coarser, because every column at that size contains some working time. Snapping still applies.
Assign a calendar when the project is created (Creating a new project) or afterwards on Options → Dates.
Styles
Styles live on the project, not globally, which keeps one customer's branding out of another's plan. Two commands bridge that:
- Generate rebuilds the standard set on the current project — useful after someone has deleted or mangled them.
- Copy to another project takes a Company and a Project and copies the selected styles there. Styles are matched by name, so copying over an existing name updates it and every activity already pointing at it.
The pattern for a partner with house branding: build the styles once on a reference project and copy them into each new customer project after generation.
Security
Access to this module is granted the standard D365 way — a role carries duties, a duty carries privileges, and a privilege names the menu items and entities it opens. The module adds no roles of its own: it ships three privileges and hangs them off four duties that already exist in the main Eftsure module, so a user who can already do their Eftsure job picks up the matching project access with no extra assignment.
Three privileges
| Privilege | Label | What it opens |
|---|---|---|
PESProjPrivilege | Projects | The whole user interface — 18 entry points: the Projects form and the activity form and part, the five New project menu items, Assign, Notify, Schedule, Styles copy, Default, Refresh, and the six export actions (DOCX, XLSX, PPTX, HTML, MS Project and the export host) |
PESProjEntityMaintain | Projects maintain | Create, read, update, delete and correct on all ten data entities |
PESProjEntityView | Projects view | Read on the same ten entities, nothing else |
Four duties
| Duty | Privileges it gains | What that means in practice |
|---|---|---|
| PESAdmin | PESProjPrivilege, PESProjEntityMaintain, PESProjEntityView | Everything: the full interface, and import and export through the entities |
| PESConfigure | PESProjPrivilege, PESProjEntityMaintain | The full interface, and entity read/write. The normal duty for a consultant running implementations |
| PESMaintain | PESProjPrivilege, PESProjEntityMaintain | The same as PESConfigure for this module — a customer-side project manager or key user |
| PESSupport | PESProjPrivilege | The interface only. No entity access, so no DMF import or export and no OData reads |
Which Eftsure roles carry those four duties is defined in the main Eftsure module rather than here. To see it for a given environment, open System administration → Security → Security configuration, pick the role, and look at its duties.
PESProjEntityView is read-only on the entities — it covers an integration or an OData query, not a person. There is no duty or role that opens the Projects form in a read-only state: anyone who has PESProjPrivilege can edit, reschedule and delete activities, and can delete a whole project. If you need someone to look without touching, send them an export (Exporting projects) rather than a logon.
Limits, gaps and cautions
Tested limits
A real implementation plan is around thirty-three activities in eleven phases. Everything below was pushed well past that on purpose, so you know where the edges are rather than guessing.
| Tested to | What happened | |
|---|---|---|
| Activities in one project | 2,084, five levels deep | The form opens, the Activities grid sorts and the Timeline renders within a few seconds. The consistency rebuild and a large subtree delete are the same |
| Children under one parent | 1,050 | Imported, rendered and scrolled. The Timeline virtualises: it expands all 1,050 in about six seconds and holds its position |
| Nesting depth | 61 levels, a stored path 305 characters long | Imports whole, nests correctly and rolls the counts up level by level. Nothing is truncated |
| Name length | 200 characters | Stored in full, truncated for display without disturbing the column or the layout |
One ceiling sits in the code rather than in the testing:
- The rebuild supports 50 levels. Below that it renumbers everything; beyond it, the rows are left as they are and the rebuild reports that it has done so. The stored path itself has room for about 250 levels, and the sibling ordinal is four characters wide, so around 9,999 children under one parent.
On a deeply nested plan the indent eventually pushes names out of the Step column. Drag the border in the Timeline header to widen it — Step and Assigned are both resizable, as much as you need. The width is a view setting for the moment you are in, not part of the plan: it goes back to the default when the page is reloaded.
Nothing here constrains a real deployment plan. Two thousand activities and five levels is comfortable.
Collapse state belongs to the plan
Whether a summary is open or closed is part of the Timeline's saved state, not a per-user preference. It survives the session and the user, so everyone opens the plan the way it was last left — and a screenshot taken for a status email or a steering pack shows the plan exactly as the rest of the team sees it.
Smaller ones
- Nothing is shaded at week zoom or coarser (Working calendars).
- Dragging a narrow bar tends to resize it rather than move it, because at that width the bar is mostly resize handle.
- The lookup beside the Eftsure and Customer columns lists D365 users, not the role names the methodology ships with. Both columns accept free text, so a role like Project Manager can be typed back in, but it cannot be picked from the list.
Appendix A — Where each setting lives
| I want to… | Go to |
|---|---|
| Change the project name | Projects tab, Name column |
| Mark a project finished | Projects tab, Completed — this also reveals Hypercare |
| Change the working calendar | Options → Dates |
| Change the accent colour | Options → Colors |
| Change who the status email goes to | Options → Contacts |
| Keep generated documents | Options → Documents → Archive generated documents |
| Turn activity icons off | Options → Documents → Icons |
| Hide the activities a customer does not need | Timeline or Activities toolbar → Hide optional |
| Re-parent an activity | Activities → General → Parent activity, or the indent buttons |
| Change a bar's colour | Activities → Display → Style, or edit the style on the Styles tab |
| Understand the row colours in the Activities grid | They are the activity's state, not its style — see Display |
| Send the weekly status update | The envelope button in the window header — Status update email |
| File a dated snapshot of the chart | The camera button in the window header — Screenshots |
| See what the Word, Excel and PowerPoint exports look like | What the four attachments look like |
| Deploy or upgrade the module | Deploying the module — and match the main eftsure module's version |
| Add a dependency | Activities → Links |
| Add a dated line across the chart | Milestones tab → New marker |
| Record a post-go-live issue | Hypercare tab (project must be Completed) |
| Understand the row colours in the Hypercare list | Amber is Open, green is Closed — Hypercare tab |
| Change the icon on a row | Any Icon field — the symbol picker, Hypercare tab → Symbol picker |
Appendix B — Glossary
- Activity — a task with dates, an owner and a completion percentage.
- Summary — a container activity; its bar spans its children and its figures roll up from them.
- Milestone — a point in time with no duration.
- Vertical marker — a dated line drawn across the whole chart, owned by the project.
- Milestone marker — a dated icon attached to one activity.
- Project status — the Overview's one-symbol verdict on the project: On track (green), Warning (amber) or Attention (red). Set by clicking the symbol, which cycles through the three.
- Style — a named set of formatting that activities refer to by name.
- Optional — an activity the chosen implementation package does not require; can be hidden.
- Hierarchy path — the stored position of an activity in the tree; maintained by the module, never edited by hand.
- Package — Essentials, Advanced or Enterprise; how much of the methodology is generated.
- Project type — what the customer already has; which phases are generated.
- Level — the methodology's own label for an activity's tier; a text field, not the depth of the tree.
- Hypercare — the post-go-live period, and the list of issues raised during it; appears once a project is marked Completed.
- Working calendar — the open days and hours a project plans against; governs chart shading and where a dragged activity may start.
- Methodology version — which version of the template a project was generated from, shown in the Version column. Not the version of the installed module.
- Deployable package — the compressed file the module is installed from; its version must match the main Eftsure module.